Overview:
Similar to the measures of central tendency the quantile is a measure of location.
The quantile() function of Pandas DataFrame class computes the value, below which a given portion of the data lies.
Example:
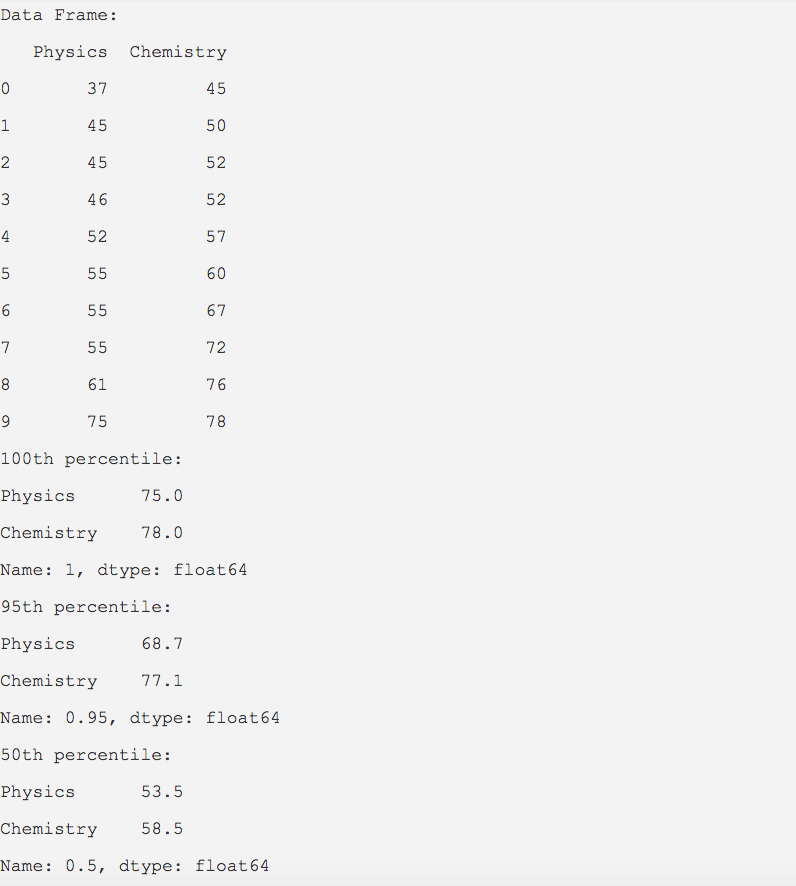
The Python example prints for the given distributions - the scores on Physics and Chemistry class tests, at what point or below 100%(1), 95%(.95), 50%(.5) of the scores are lying.
|
import pandas as pd
scores = {"Physics":(37,45,45,46,52,55,55,55,61,75), "Chemistry":(45,50,52,52,57,60,67,72,76,78)};
dataFrame = pd.DataFrame(data=scores); print("Data Frame:"); print(dataFrame);
# Compute the 100th percentile quantileValues = dataFrame.quantile(1); print("100th percentile:"); print(quantileValues);
# Compute the 95th percentile quantileValues = dataFrame.quantile(.95); print("95th percentile:"); print(quantileValues);
# Compute the 50th percentile quantileValues = dataFrame.quantile(.50); print("50th percentile:"); print(quantileValues); |
Output: