Overview:
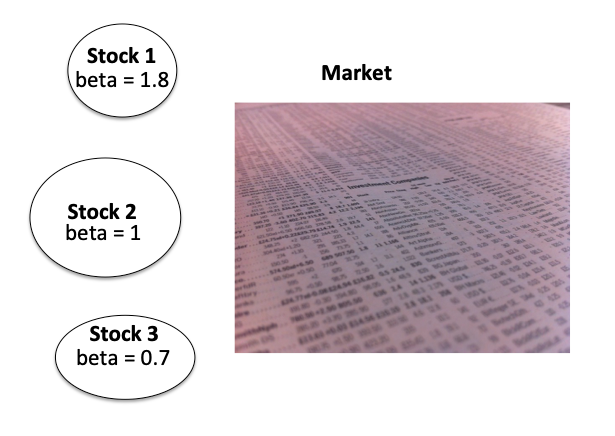
- The Beta of a stock indicates how volatile a stock performs against a benchmark index or to the market.
- If the value of beta is more than one it means the stock responds to an event more than the index responds to that event. If the beta is one it means the stock just follows the index. As the beta moves below one, it responds less and less to market events when compared to the index. As far the maximum value of the beta, the markets have seen some of the popular stocks with a beta higher than two in the past.
- The Python example, starts with individual stock prices and their volumes held in an investment portfolio along with the beta values for each of the stock.
- To calculate the beta for the whole investment portfolio, the overall portfolio size is computed by summing up each of the investment values.
- The fraction of each investment to the whole portfolio is found, which are multiplied with individual betas and the resultant values are summed up to arrive at the beta of the whole investment portfolio.
- In the Python example as the new values like investment value in each stock, fraction of each investment to the value of the whole portfolio, fraction of each investment multiplied by individual beta values - are calculated, they are added to the original pandas DataFrame as columns.

Example:
|
# An example Python program that finds the beta of an investment portfolio # Column headers # Load the Investment data into a DataFrame investmentData = pds.DataFrame(data=investments, columns=fields); # Calculate the value for each investment # Calculate the Portfolio Contribution for each investment # Now calculate the weighted beta # Compute the Portfolio Beta |
Output:
|
Company Stock Price Quantity Beta 0 MicroSoft 246.48 100000 0.79 1 Google 2356.09 125000 1.00 2 Chevron 103.56 200000 1.32 3 ExxonMobil 59.36 100000 1.41 4 Intel 56.62 300000 0.66 5 AMD 78.17 325000 2.06 Company Stock Price Quantity Beta Value Portfolio Contribution Weighted Beta 0 MicroSoft 246.48 100000 0.79 24648000.0 0.06 0.0474 1 Google 2356.09 125000 1.00 294511250.0 0.76 0.7600 2 Chevron 103.56 200000 1.32 20712000.0 0.05 0.0660 3 ExxonMobil 59.36 100000 1.41 5936000.0 0.02 0.0282 4 Intel 56.62 300000 0.66 16986000.0 0.04 0.0264 5 AMD 78.17 325000 2.06 25405250.0 0.07 0.1442 Portfolio Beta:1.072 |