Function Signature:
mean(sequence)
Parameters:
sequence - A Python sequence or an iterable. e.g., A Python list.
Return value:
The arithmetic mean of the distribution is returned. The type can be an int or a float value.
Overview:
-
The expected value of the outcome from a random variable is called mean. It is the average value of a distribution.
-
The mean is computed by summing all the outcomes of a random variable in a sample and dividing the sum by the number of items in the sample.
-
Mean is a measure of central tendency. The mean of a sample or distribution describes where the values are centred. The other measures of central tendencies being the median and mode.
-
Mean may not give the right idea about the expected value if some of the values of the sample are too large or too small, which are called outliers.
-
Mean is not the middle value of the distribution. The middle value of the distribution is the median which divides the distribution into two.
-
The function mean() from the module statistics accepts any Python sequence or an iterable as a parameter and returns the arithmetic mean of the elements.
Example:
|
# Example Python program that finds the mean of the distribution distribution = [10, 15, 17, 25, 30, 90, 180] oneSDDistance = arithmeticMean + standardDeviation figr = plt.figure() # Title and axis labels # Scatter plot of the distribution # Mark the mean of the distribution # Mark the one standard deviation # Mark the two standard deviation # Annotations text = "1 SD" text = "2 SD" # Display the scatter plot |
Output:
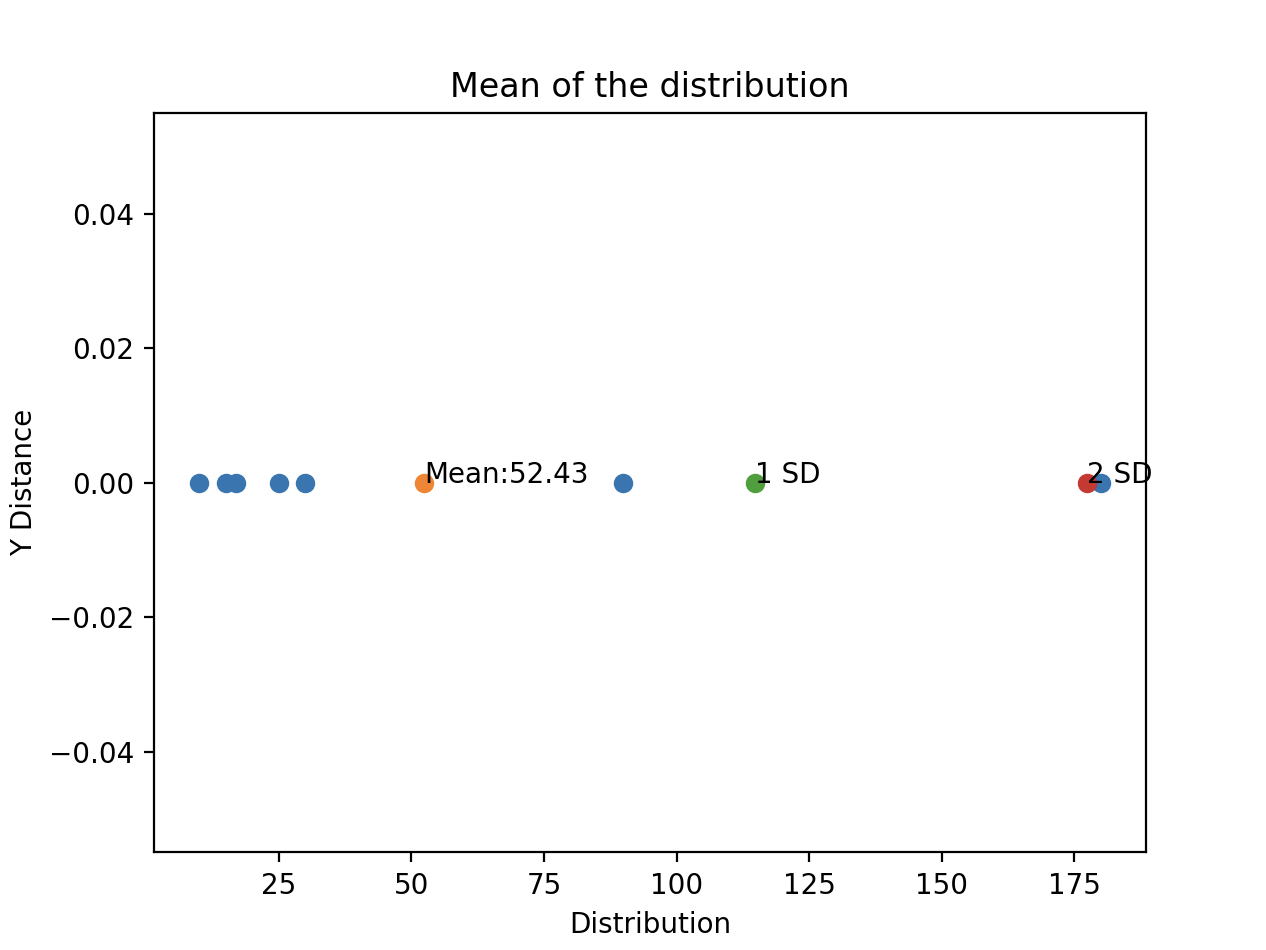
The Python program creates a scatter plot of the distribution. The values of the distribution are marked in “Blue”. The mean is marked in “Amber”. The distances in X axis that are one standard deviation and two standard deviations away from the mean are marked in “Green” and “Red”.
The scatter plot shows that the mean value of 52.43 is significantly away from most of the values of the distribution. The values of the distribution that make the mean larger are 90 and 180. The value 180 is clearly an outlier as it lies two standard deviations away from the mean.
Extreme values of the distribution that are bigger or smaller can be replaced and the effect can be witnessed as it changes the mean value.