Overview:
It is a frequent requirement in data analysis to calculate how much percentage a variable has changed over a time period. Examples include percentage change in end of day closing prices of stocks, percentage change in daily temperature and others.
A pandas DataFrame can be loaded with multiple time series data of multiple variables, where each column of the DataFrame corresponds to a time series.
Once time series data is mapped as DataFrame columns, the rows of DataFrame can be used for calculating percentage change of the variables.
The pct_change() method of DataFrame class in pandas computes the percentage change between the rows of data.
Note that, the pct_change() method calculates the percentage change only between the rows of data and not between the columns. Whereas, the diff() method of Pandas allows to find out the difference between either columns or rows.
The percentage change can be computed not only for the subsequent rows but also for alternate rows with intervals defined through periods parameter.
When the periods parameter assumes positive values, percentage change is computed by subtracting the previous row from the current row and divding the value by previous row.
When the periods parameter is negative, percentage change is computed by subtracting the next row from the current row and divding the value by next row.
Example:
|
import pandas as pd
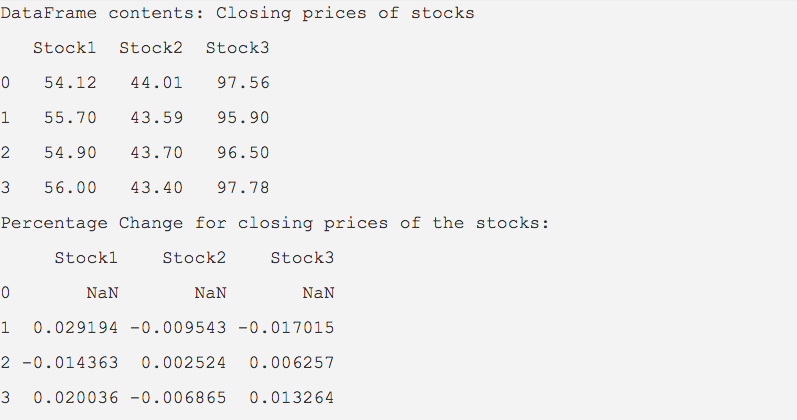
# Closing prices of three stocks as a python dictionary closingPrices = {"Stock1":(54.12, 55.70, 54.90, 56.00), "Stock2":(44.01, 43.59, 43.70, 43.40), "Stock3":(97.56, 95.90, 96.5, 97.78)}
# Construct a DataFrame from the dictionary object eodPrices = pd.DataFrame(data=closingPrices); print("DataFrame contents: Closing prices of stocks") print(eodPrices);
# Compute percentage changes percentageChange = eodPrices.pct_change(); print("Percentage Change for closing prices of the stocks:"); print(percentageChange); |
Output:
Example 2: With intervals defined
|
import pandas as pd
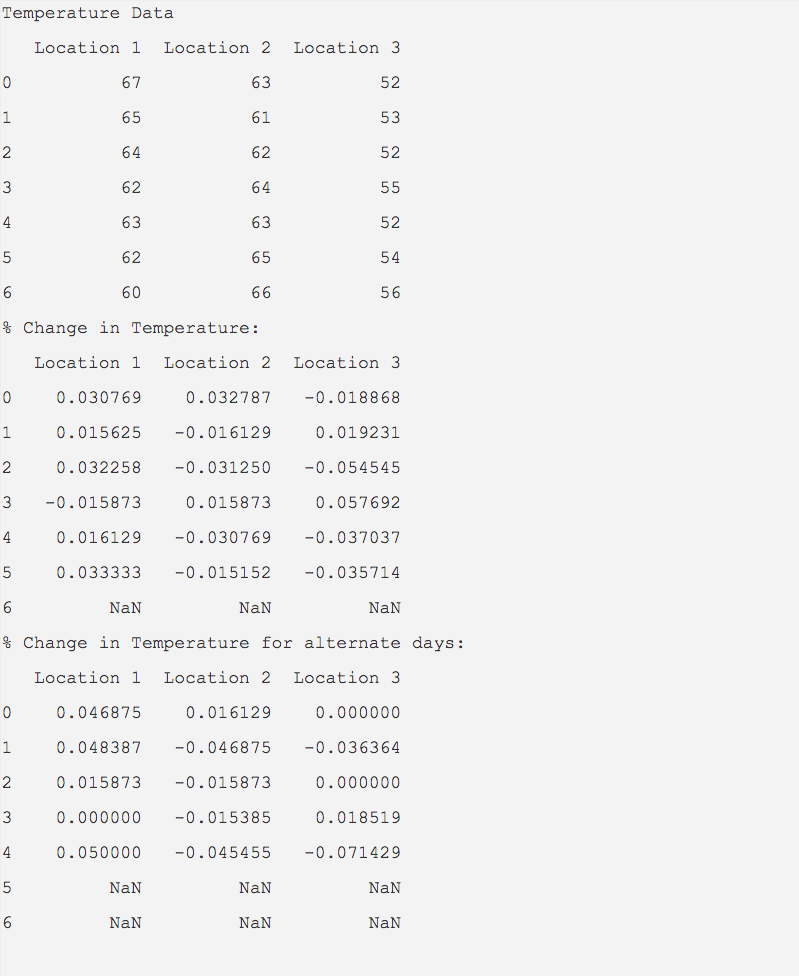
temperature = {"Location 1" : (67, 65, 64, 62, 63, 62, 60), "Location 2" : (63, 61, 62, 64, 63, 65, 66), "Location 3" : (52, 53, 52, 55, 52, 54, 56)};
dataFrame = pd.DataFrame(data=temperature);
print("Temperature Data"); print(dataFrame);
print("% Change in Temperature:") pctChange = dataFrame.pct_change(periods=-1); print(pctChange);
print("% Change in Temperature for alternate days:") pctChange = dataFrame.pct_change(periods=-2); print(pctChange); |
Output: