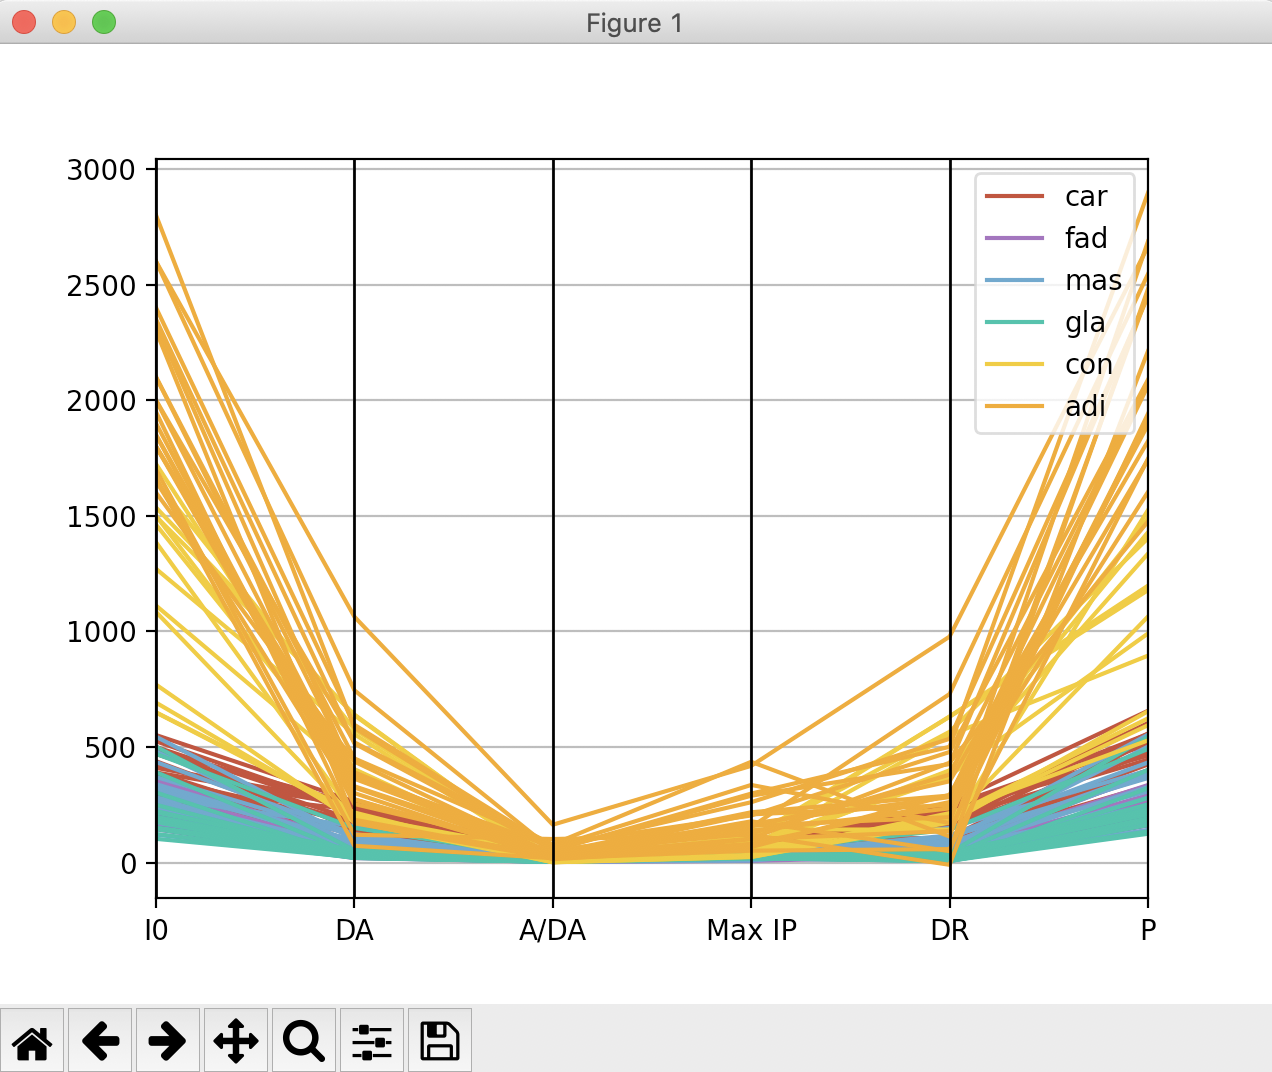
Overview:
- Parallel coordinates is one of the oldest visualization techniques for understanding multivariate data.
- In a parallel coordinates plot, variables are represented through vertical parallel lines. These lines form the axes for the plot.
- Each data point of the multivariate data is marked in these vertical axes which result in a polyline.
- One data point corresponds to one polyline. In case of multiple data points with the same values, a poly line is drawn multiple times, one over another.
- The height of the vertical axes does not correspond to any order in the data.
- The parallel axis of the parallel coordinates plot can be drawn horizontally as well.
- The lines denoting the data point are typically not smooth as in case of Andrews Curves, which is another visualization technique that projects the multivariate data to a vector formed by the co-efficients of the finite Fourier series.
Example:
|
# Example Python program that creates # Read data from a CSV file into a DataFrame # Use the DataFrame instance and draw the parallel coordinates plot plt.show(block=True); |
Output:
