Overview:
- Pie charts display how much a specific variable or quantity contributes to the whole, where the whole represents 100%.
- Each variable is represented as a wedge.
- The data with a value zero will not have any wedge in the pie chart.
- Calling the pie() function of the plot member on a pandas Series instance, plots the pie chart for the Series data.
Example:
|
# Example Python Program to draw a pie chart for the data # present in a pandas Series object import pandas as pds import matplotlib.pyplot as plt
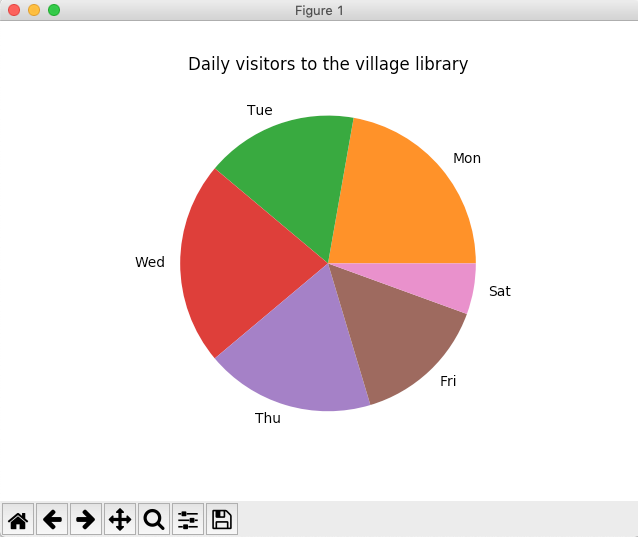
# Daily visitors data = [0,120,90,120,100,80,30];
# Create a pandas series series = pds.Series(data, index=("Sun", "Mon", "Tue", "Wed", "Thu", "Fri", "Sat"));
# Create a pie chart series.plot.pie(label="", title="Daily visitors to the village library");
plt.show(block=True); |
Output: