Overview:
-
Given a set of points on a Euclidean Plane the Voronoi diagram creates regions that are closer to the given points. The regions consist of neighbourhood points that are close to the given points than to any other points belonging to other regions.
-
The applications of Voronoi diagrams extend to numerous fields of studies which include Computational Geometry, Town Planning, Site design Biology, Crystallography, Physiology and many others.
-
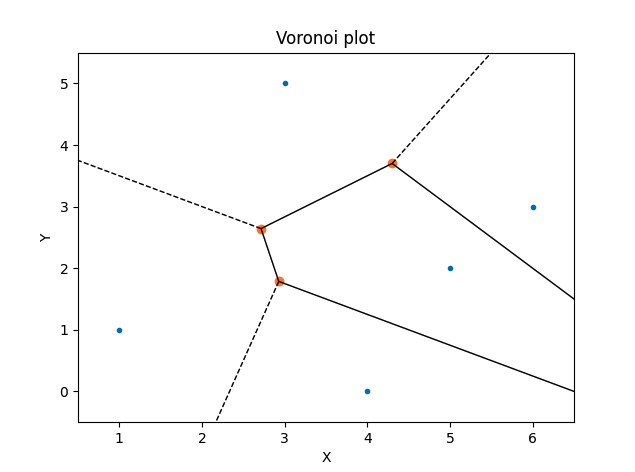
The SciPy function voronoi() from the scipy.spatial module returns an voronoi instance. The function voronoi_plot_2d() plots a voronoi() diagram. The function along with matplotlib uses the voronoi instance to draw the edges and vertexes of the voronoi diagram.
-
It is also called as Voronoi tessellation. Tessellation is arranging regions of various shapes together without any gaps or overlapping.
Example:
|
# Example Python program that draws a Voronoi diagram points = [(1,1), [3,5], [4,0], [5,2], [6, 3]] # Draw the voronoi diagram for the set of given points |
Output: