Overview:
- A Box plot, which is commonly known as the Box and whisker plot divides the given data in to different quartiles.
- A Quartile is a measure of central tendency that divides a data set in to 4 parts.
- The Box Plot would have a box depicted for each data point extending from the first quartile to the fourth quartile values.
- A vertical line is represented in the center of the box, which is the median of each data point in the data set.
- Here, the X-axis has the data for which the box plot has to be drawn and the Y-axis denotes the frequency distribution.
- To draw a box plot, the pre-requisites are the median of the data, the upper and lower quartiles, the highest and the lowest value in the distribution.
- A box plot can be generated either horizontally or vertically.
- Matplotlib offers boxplot() as part of the matplotlib.pyplot module which is used for plotting box plots.
Example:
|
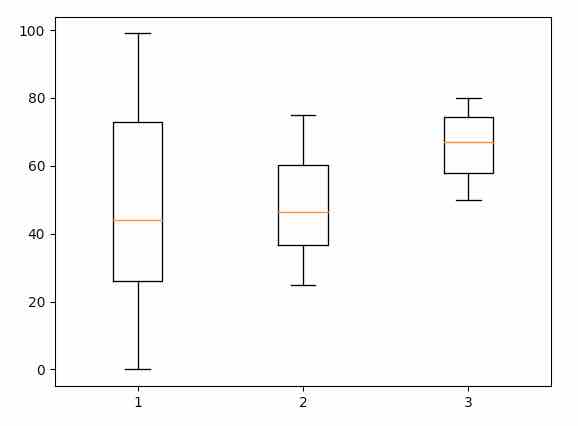
import matplotlib.pyplot as plot import numpy as np
#Generate the data sequence1 = np.random.random_integers(0,100,100) sequence2 = np.random.random_integers(25,75,100) sequence3 = np.random.random_integers(50,80,100)
plot.boxplot((sequence1, sequence2, sequence3)) plot.show() |
Output: