Overview:
- An Area Plot is an extension of a Line Chart.
- An Area Plot is obtained by filling the region between the Line Chart and the axes with a color. When more than one Area Plot is shown in the same graph, each area plot is filled with a different color.
- Due to the color-fill effect of an area plot, the quantum and the trend of the variable is distinctly visible without making much effort. Though it is possible to do the same with line charts, interpretation is not immediate, hence it takes time to comprehend multiple Line Charts plotted on a graph.
Types of Area Plots:
- Overlapping Area plots: In this scheme, multiple area plots are displayed in a graph with their areas overlapping. Drawing overlapping area plots require the color-fill effect to be transparent.
- Stacked Area plots: Multiple area plots stacked one on top of another or one below another.
- Percentage based area plot: An area plot drawn to plot variables with a maximum value of 100. Percentage based area plots can be drawn either with a stacked or with an overlapped scheme.
Drawing area plot for a pandas DataFrame:
- DataFrame class has several methods for visualizing data using various diagrams. Area plot is one among them.
- To get an area plot for a pandas DataFrame, make a Python call: dataFrameinstance.plot.area().
- Area plot is drawn using the plot member of the DataFrame.
- If True is specified for the Boolean parameter stacked, area() draws a stacked area plot. It is the default behavior for the area() method.
- To make an unstacked or overlapped area plot, the stacked parameter should be given the Boolean value "False".
- To draw a percentage based area plot, a new DataFrame can be created with normalized values and area plot can be plotted for the new DataFrame.
Example – Overlapped Area Plot for a DataFrame:
|
# Example Python program to draw an overlapped area plot # for a pandas DataFrame import pandas as pd import matplotlib.pyplot as plot
# Peak Temperature data for two cities tempData = {"City1":[99, 106, 102, 78], "City2":[77, 84, 80, 85]}; # Seasons seasons = ("Spring", "Summer", "Fall", "Winter");
# Create a DataFrame instance dataFrame = pd.DataFrame(tempData, index=seasons);
#Draw an area plot for the DataFrame data dataFrame.plot(kind='area', stacked=False) plot.show(block=True); |
Output:

Example – Stacked Area Plot for a DataFrame:
|
# Example Python program that draws a overlapping area # plot for a pandas DataFrame instance import pandas as pd import matplotlib.pyplot as plot
# Number of observations data = [(25, 1), (43, 1), (35, 2), (34, 4)];
# Years index = ["2016", "2017", "2018", "2019"]; # (X Axis)
# Name of the Quantities corresponding to the observations(Y Axis) columns = ["Meteors", "Meteorites"];
# Create DataFrame instance df = pd.DataFrame(data=data, index = index, columns = columns);
# Draw an area plot that overlaps ax = df.plot.area(stacked=True);
plot.show(block=True); |
Output:

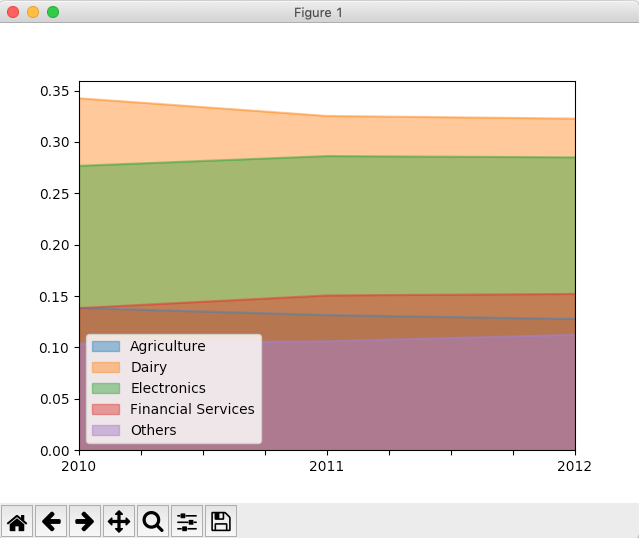
Example – Percentage based Area Plot for a DataFrame – Overlapped:
|
# Example Python program to draw a percentage based Area # plot for a pandas DataFrame import pandas as pd import matplotlib.pyplot as plot
gdpRevenue = {"Agriculture" :(200, 192, 193), "Dairy" :(495, 475, 488), "Electronics" :(400, 418, 431), "Financial Services":(200, 220, 230), "Others" :(150, 155, 170) };
index = ("2010", "2011", "2012");
dataFrame = pd.DataFrame(data=gdpRevenue); normalized = dataFrame.div(dataFrame.sum(axis=1), axis=0); normalized.index = index; print(normalized); normalized.plot.area(stacked=False); plot.show(block=True); |
Output:
Example – Percentage based Area Plot for a DataFrame – Stacked:
|
# Example Python program to draw a percentage # based area plot(stacked) for a Python pandas DataFrame
import pandas as pd import matplotlib.pyplot as plot
zonalRevenue = {"East" : (25, 27, 32, 31), "West" : (32, 40, 39, 44), "South" : (34, 31, 32, 34), "North" : (27, 26, 22, 28) };
dataFrame = pd.DataFrame(data=zonalRevenue);
# Normalize Data normalizedDataFrame = dataFrame.div(dataFrame.sum(axis=1), axis=0);
years = ("2016", "2017", "2018", "2019"); normalizedDataFrame.index = years;
# Draw a percentage based, stacked area plot normalizedDataFrame.plot.area(stacked=True); plot.show(block=True); |
Output:
