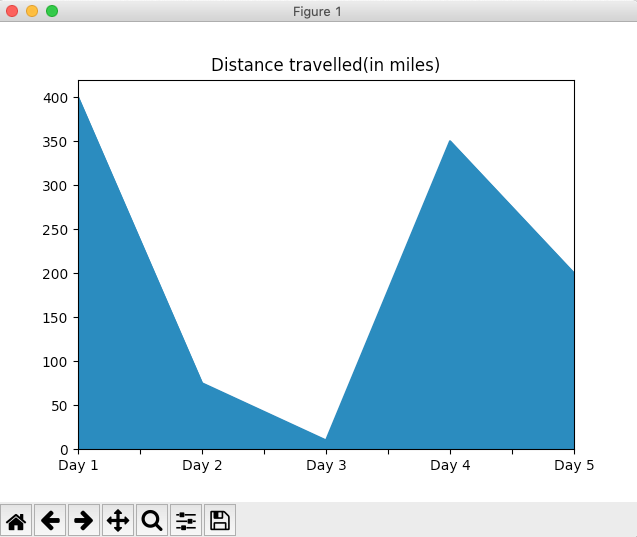
Overview:
- An area plot is obtained from a line chart by filling the area between the line and the axis with a colour.
- Compared to the line chart, it is easy to understand the trend of the graph or data using an area plot because of the presence of the coloured area.
- An area plot can be drawn from the data present in a pandas Series using the plot.area() function. Note that plot is a member/attribute of the pandas Series class.
- To draw an area plot for a pandas DataFrame, the area() function can be called on the plot instance of the pandas.DataFrame object.
Example:
|
# Example Python program to draw an Area Plot # for the data present in a pandas.Series object
import pandas as pds import matplotlib.pyplot as plt
# Distance covered on each day as a Python list distanceCovered = [400, 75, 10, 350, 200];
# Create a pandas Series using the Python list series = pds.Series(distanceCovered, index=("Day 1", "Day 2", "Day 3", "Day 4", "Day 5"));
# Draw an area plot series.plot.area(title="Distance travelled(in miles)"); plt.show(block=True);
|
Output:
