Overview
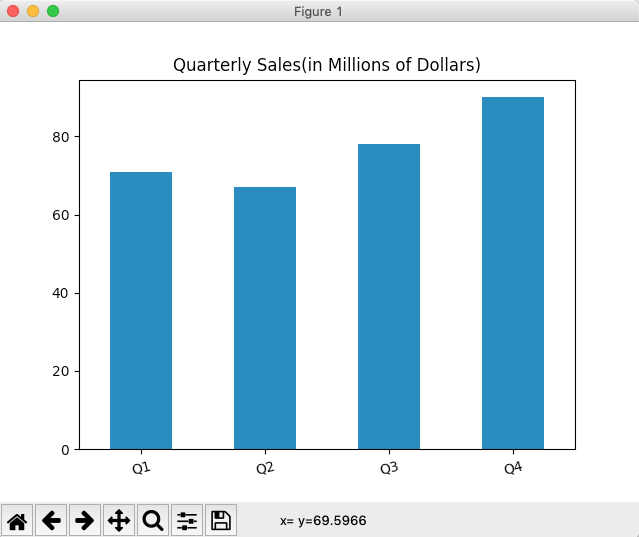
- In a vertical bar chart, the X-axis displays the categories and the Y-axis displays the frequencies or percentage of the variable corresponding to the categories.
- Calling the bar() function on the plot member of a pandas.Series instance, plots a vertical bar chart. In the same way, to plot a bar chart for a DataFrame, the bar() function can be invoked on the plot member of a pandas DataFrame instance.
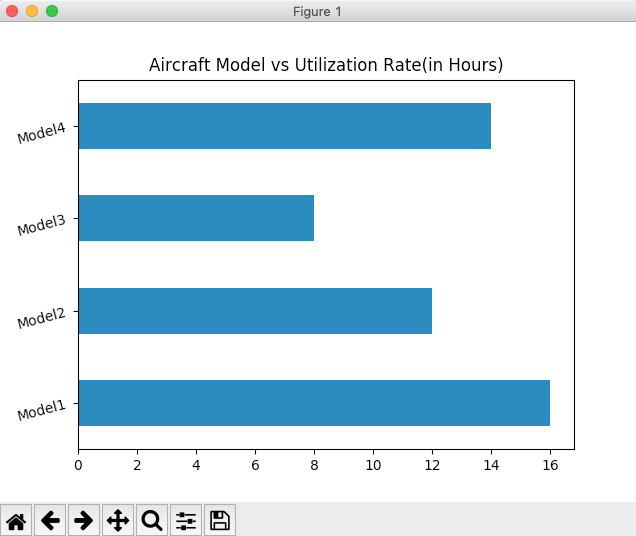
- A horizontal bar chart for the series data can be plotted using the barh() function of Series.plot member.
Example - Drawing a Vertical Bar Chart for the data in a pandas Series
# Example Python program to draw a vertical bar chart from a Pandas Series

import pandas as pds

import matplotlib.pyplot as plt

# Create a pandas Series object

ser = pds.Series([71, 67, 78, 90], index=("Q1","Q2","Q3","Q4"));

# Draw the bar chart

ser.plot.bar(rot=15, title="Quarterly Sales(in Millions of Dollars)");

plt.show(block=True);
Output
Example - Drawing a Horizontal Bar Chart for the data from a pandas Series
# Example Python program to draw a horizontal bar chart

# for the data present in Pandas Series

import pandas as pds

import matplotlib.pyplot as plt

# Create a pandas Series object

utlizationRate = [16, 12, 8, 14]

series = pds.Series(utlizationRate, index=("Model1", "Model2", "Model3", "Model4"));

# Draw the bar chart

series.plot.barh(rot=15, title="Aircraft Model vs Utilization Rate(in Hours)");

plt.show(block=True);
Output