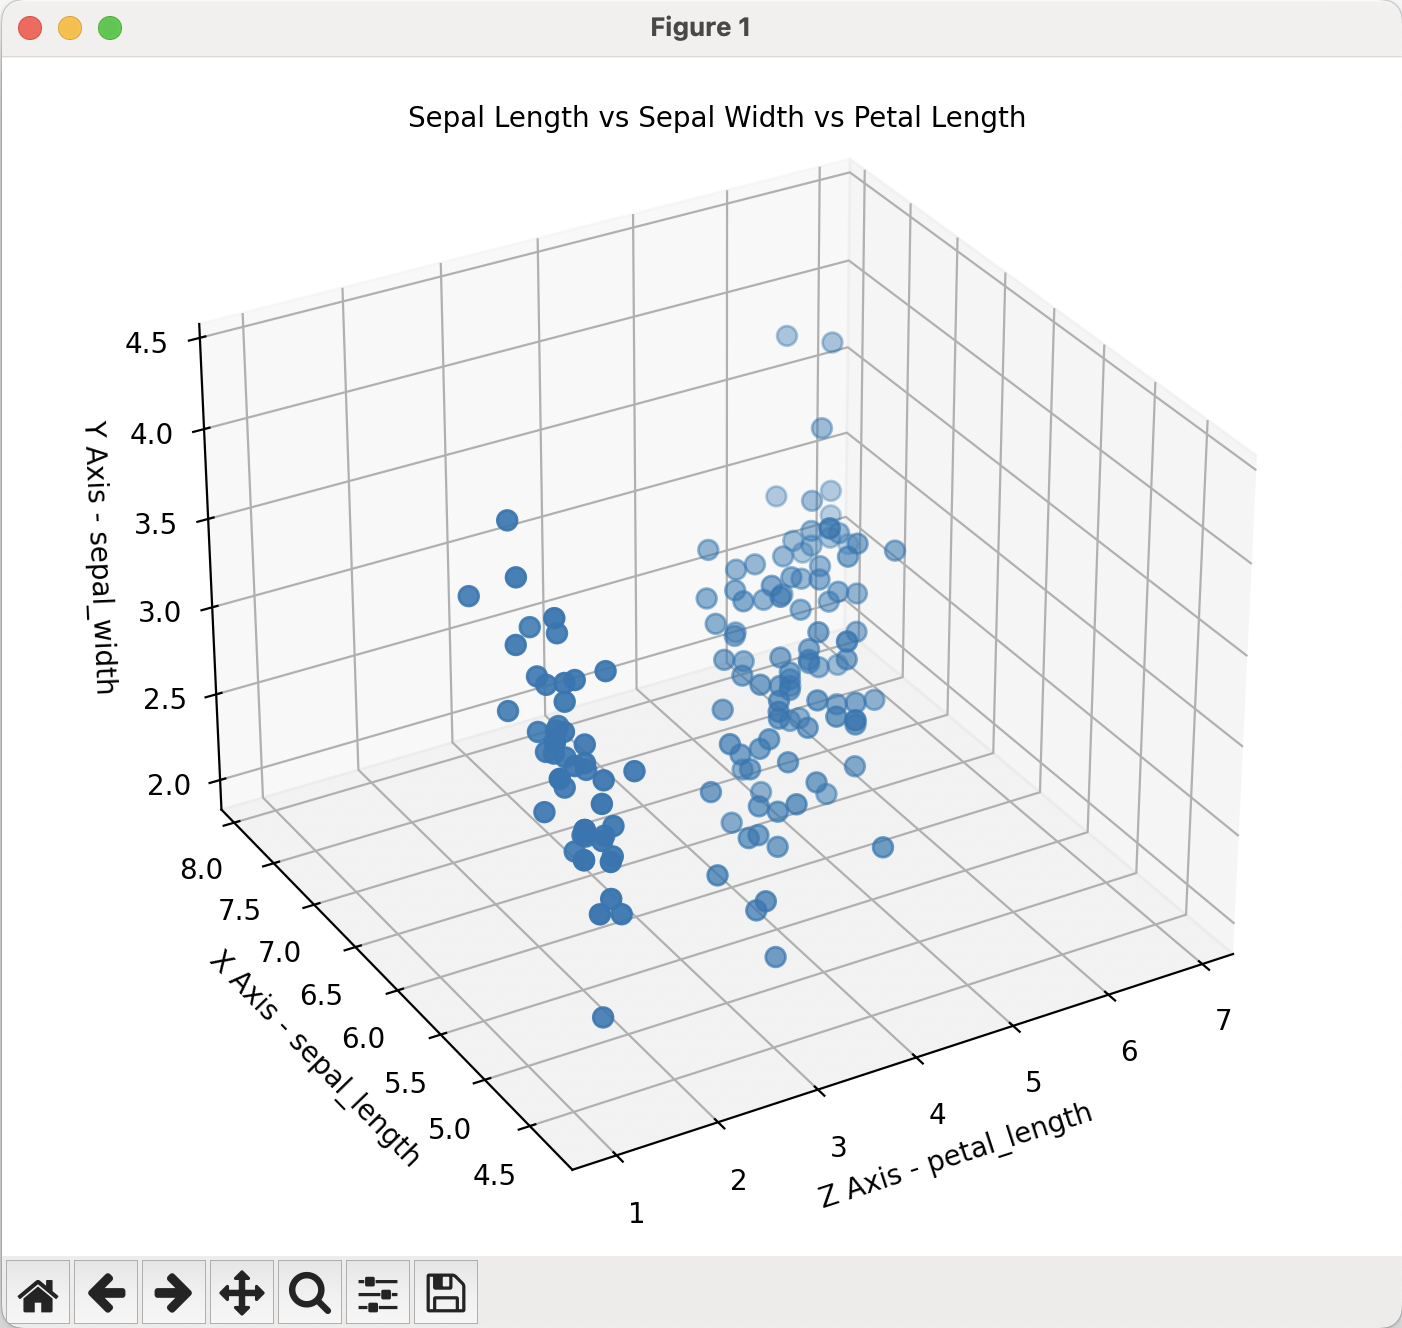
Overview:
- A 3-d scatter plot marks how a dependent variable behaves in accordance with two other independent variables.
- A 3-d scatter plot is drawn using a given dataset consisting of (X, Y, Z) data points a.k.a. trivariate data - where X, Y are independent and Z is dependent on X, Y.
- The X axis is the horizontal axis, the Z axis is the depth axis and the Y axis is the vertical axis.
Example:
|
# Example Python program that uses csv.reader plt.style.use('_mpl-gallery') sepal_lengths = [] # Read from the CSV file for row in csvReader: rowIndex = rowIndex + 1 sepal_lengths_np = np.array(sepal_lengths, dtype=float) # Plot # Set the graph size ax.view_init(vertical_axis='y', elev=30, azim=-120, roll=0) # Labels and title plt.show() |
Output:
