Overview:
- A sawtooth wave is a periodic waveform and it is non-sinusoidal.
- A sawtooth wave rises upwards and drops sharply. A sawtooth wave can also go down and rise sharply which is called as "reverse sawtooth wave" or "inverse sawtooth wave".
- Saw tooth waves have their applications in music synthesizers, in CRT based video displays and in Oscilloscopes.
- Sawtooth waves can be plotted using the python libraries scipy and matplolib.
- The function signal.sawtooth() returns a periodic sawtooth waveform or a triangular waveform.
Example:
|
# import the required python modules import numpy as np from scipy import signal import matplotlib.pyplot as plot
# Create 1000 linearly separated points with values between 0 to 1 timePoints = np.linspace(0, 1, 500)
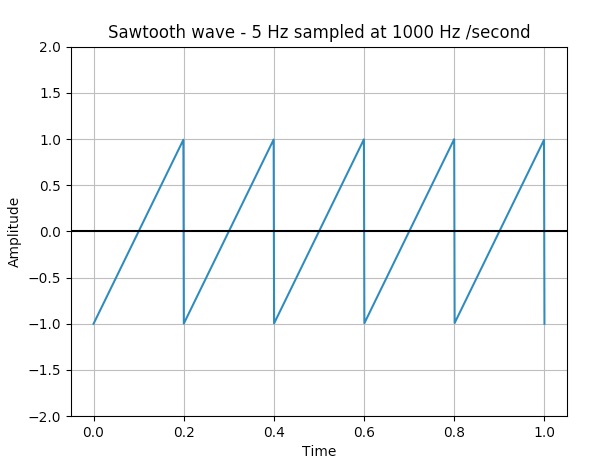
# Sawtooth wave frequency 5Hz; sampling frequency 500 Hz plot.plot(timePoints, signal.sawtooth(2 * np.pi * 5 * timePoints))
# Give a title for the sawtooth wave plot plot.title('Sqaure wave - 5 Hz sampled at 1000 Hz /second')
# Give x axis label for the sawtooth wave plot plot.xlabel('Time')
# Give y axis label for the sawtooth wave plot plot.ylabel('Amplitude')
plot.grid(True, which='both')
# Provide x axis and line color plot.axhline(y=0, color='k')
# Set the max and min values for y axis plot.ylim(-2, 2)
# Display the sawtooth wave plotted plot.show() |
Output: