Overview:
- Kernel Density Estimation(KDE) is a non-parametric way to find the Probability Density Function(PDF) of a given data.
- Kernel Density Estimation can be applied regardless of the underlying distribution of the dataset.
- The Kernel Density Estimation function has a smoothing parameter or bandwidth ‘h’ based on which the resulting PDF is either a close-fit or an under-fit or an over-fit.
Drawing a Kernel Density Estimation-KDE plot using pandas DataFrame:
- In Python, invoking the kde() method on the plot member of a pandas DataFrame class draws a Kernel Density Estimation plot.
Example:
|
# Python example program to plot Probability Density Function # using Kernel Density Estimation(KDE) import pandas as pd import matplotlib.pyplot as plot
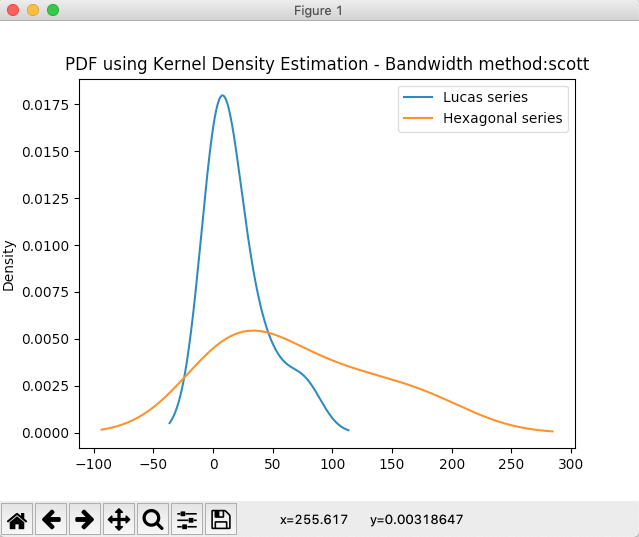
# Data as a Python Dictionary dataDictionary = {"Lucas series":[2, 1, 3, 4, 7, 11, 18, 29, 47, 76], "Hexagonal series":[1, 6, 15, 28, 45, 66, 91, 120, 153, 190]};
# Create a DataFrame dataFrame = pd.DataFrame(data = dataDictionary);
# Plot PDF using KDE with different bandwidth values dataFrame.plot.kde(title="PDF using Kernel Density Estimation - Bandwidth method:scott"); dataFrame.plot.kde(bw_method=0.3, title="PDF using Kernel Density Estimation - Bandwidth value=0.3"); dataFrame.plot.kde(bw_method=3, title="PDF using Kernel Density Estimation - Bandwidth value=3"); plot.show(block=True); |
Output: