Line Chart:
- A line chart plots a set of (x, y) values in a two-dimensional plane and connects those data points through straight lines.
- A line chart is one of the most commonly used charts to understand the relationship, trend of one variable with another.
Drawing a Line chart using pandas DataFrame in Python:
- The DataFrame class has a plot member through which several graphs for visualization can be plotted. A line chart or line graph is one among them.
- Calling the line() method on the plot instance draws a line chart. If the column name for X-axis is not specified, the method takes the index of the column as the X-axis, which is of the pattern 0, 1, 2, 3 and so on.
- After drawing the X-axis from the index of the DataFrame or using the specified column, the subsequent numeric columns are plotted as lines against the X-axis.
Example:
|
# Example Python program to plot a line chart # for a pandas DataFrame import pandas as pd import matplotlib.pyplot as plot
# Earnings data for 4 quarters as a Python Dictionary earningsData = {"Quarterly Profit": [9.3, 9.7, 8.9, 10.2], "Quarterly Revenue": [12.7, 14.0, 12.5, 14.7] };
df = pd.DataFrame(data=earningsData);
# Draw a line chart df.plot.line(title="Quarterly earnings and profit of an organization"); plot.show(block=True); |
Output:

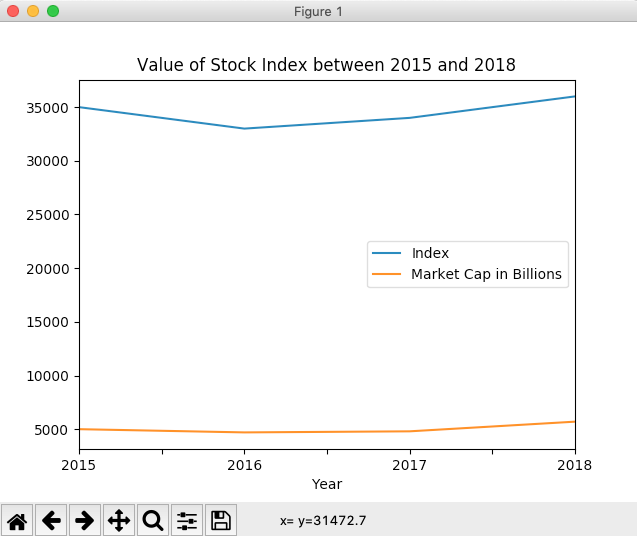
Example-X-Axis drawn from a specific column of a pandas DataFrame:
|
# Example Python program to plot a line chart # for a pandas DataFrame - with X-Axis drawn using a DataFrame column import pandas as pd import matplotlib.pyplot as plot
stockIndex = {"Year": ["2015", "2016", "2017", "2018"], "Index": [35000, 33000, 34000, 36000], "Market Cap in Billions":[5000, 4700, 4800, 5700] };
df = pd.DataFrame(data=stockIndex); df.plot.line(x="Year", title="Value of Stock Index between 2015 and 2018"); plot.show(block=True); |
Output: