Overview:
- The function Series.describe() computes the Summary Statistics/Descriptive Statistics for the data present in a pandas Series.
- The summary statistics returned by the Series.describe() function include,
- Count – The Number of elements present in the series
- Mean i.e., the average value
- Standard Deviation – How for a value in the distribution is away from the mean
- Min – The minimum value of the distribution
- Quartiles – The three quartiles that divide the distribution into four equal parts i.e., 25th percentile, 50th percentile and 75th percentile. Given these percentile values the inter quartile distance can be calculated as well.
- Max – The maximum value of the distribution
- Using the Max and Min values the range of the distribution can be calculated.
Example:
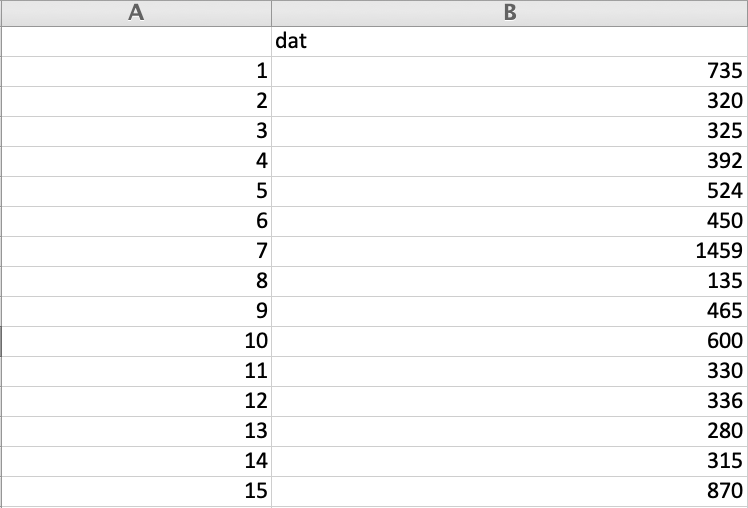
- The Python example code loads the rivers.csv file from the R Datasets package (Data Courtesy: The R Datasets Package)into a pandas DataFrame.

- From the DataFrame only the column “dat” that holds the lengths of rivers in USA is selected into a pandas Series.
- Calling describe() on the Series instance returns the summary statistics, as printed in the output.
|
# Example Python program to compute Descriptive Statistics # for a pandas series (Data Courtesy: The R Datasets Package) import pandas as pds
# Load the data from the rivers.csv dataFile = "./rivers.csv"; df = pds.read_csv(dataFile);
# Get only the river length column of the DataFrame as a series riverLength = df["dat"];
# Compute Descriptive statistics for river lengths in the USA summaryStats = riverLength.describe();
print("Summary statistics for lengths of rivers in USA"); print(summaryStats); |
Output:
|
Summary statistics for lengths of rivers in USA count 141.000000 mean 591.184397 std 493.870842 min 135.000000 25% 310.000000 50% 425.000000 75% 680.000000 max 3710.000000 Name: dat, dtype: float64 |