Overview:
- Skewness is a statistical measure that quantifies the symmetry of the distribution. Skewness is the standardized third central moment and Kurtosis is the standardized fourth central moment.
- A distribution may be skewed in the positive direction or negative direction.
- A positively skewed distribution has a long tail on the right side and negatively skewed distribution has a long tail on the left side.
- A right tailed distribution or a positively skewed distribution has its mean greater than the median as the outliers present in the skewed right tail of the distribution influence the mean.
- A left tailed distribution has its mean smaller than the median.
- In investments, assets with positively skewed return distributions have frequent small losses and few extreme gains. Assets with negatively skewed return distributions have frequent small gains and few extreme losses.
Compute Skewness of a distribution present in a pandas.Series:
- The skew() function of the pandas.Series class in Python, computes skewness for the distribution provided by the values/elements of a Series.
- The Python example loads the data from the SP500.csv(Data Courtesy:R Datasets), which has daily returns of Standard & Poor’s index for ten years from 1981 to 1991.
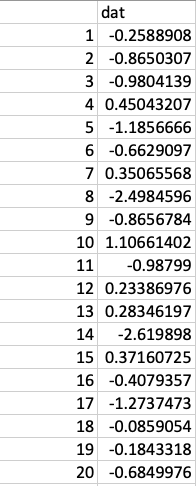
- The data is loaded into a pandas.DataFrame and the column representing the daily returns is selected into a pandas.Series instance.
- The skewness value for the returns is calculated using Series.skew() function. The result is rounded to two digits after decimal point using the function round(). If skewness calculation of multiple columns of a DataFrame is required DataFrame.skew() function can be used.
Example:
|
# Example Python program to calculate Skewness for 10 #year daily returns of Standard&Poor's 500 Index (Data Courtesy:R Datasets) import pandas as pds
spReturnsData = "./SP500.csv" dataFrame = pds.read_csv(spReturnsData); series = dataFrame["dat"]; skewness = series.skew();
print("Skewness:"); print(round(skewness,2)); |
Output:
|
Skewness: -0.2967272567583388 |