Overview:
- Kurtosis is a statistical measure that describes the peakedness of the curve of a distribution. It is defined as the fourth central moment divided by the standard deviation.
- When the distribution is thin and tall it is called a Leptokurtic distribution.
- When the distribution is Leptokurtic both of the following things happen:
- Large number of small deviations from the mean
- Large number of large deviations from the mean
- In Investment, an asset with Leptokurtic returns can mean higher probability for extremely low or extremely high returns and associated higher value at risk.
- When the distribution is less peaked or flatter than the normal distribution, it is called Platykurtic distribution. In a Platykurtic distribution, the tail of the distribution is extremely thin with outliers less than that of the normal distribution.
- When the distribution is Mesokurtic the curve resembles that of a normal distribution curve.
Finding Kurtosis for a pandas Series:
- The class Series from the Python library pandas implements a one-dimensional collection with several statistical and mathematical functions for Data Analysis.
- Series.kurtosis() function computes the Fisher’s kurtosis or Excess Kurtosis for the data present in the series. As per Fisher’s kurtosis - A leptokurtic distribution has a Kurtosis value greater than 0, a normal distribution or a mesokurtic distribution has a Kurtosis value of 0 and a Platykurtic distribution has a Kurtosis value smaller than 0. Kurtosis can be calculated for pandas.DataFrame columns and rows as well.
Example 1:
The Fisher’s Kurtosis value found for the pandas.Series instance in this example is greater than 0 and hence the distribution present in the Series is Leptokurtic.
|
# Python example program to compute kurtosis of # the distribution represented by a pandas.Series import pandas as pds
# Percentage returns from the investment on an asset returns = [3,3,10,3,5,4,5,10,4]
# Create pandas.Series instance series = pds.Series(returns)
print("Kurtosis:") print(round(series.kurtosis(), 2)) |
Output:
|
Kurtosis: 0.18 |
Example 2:
|
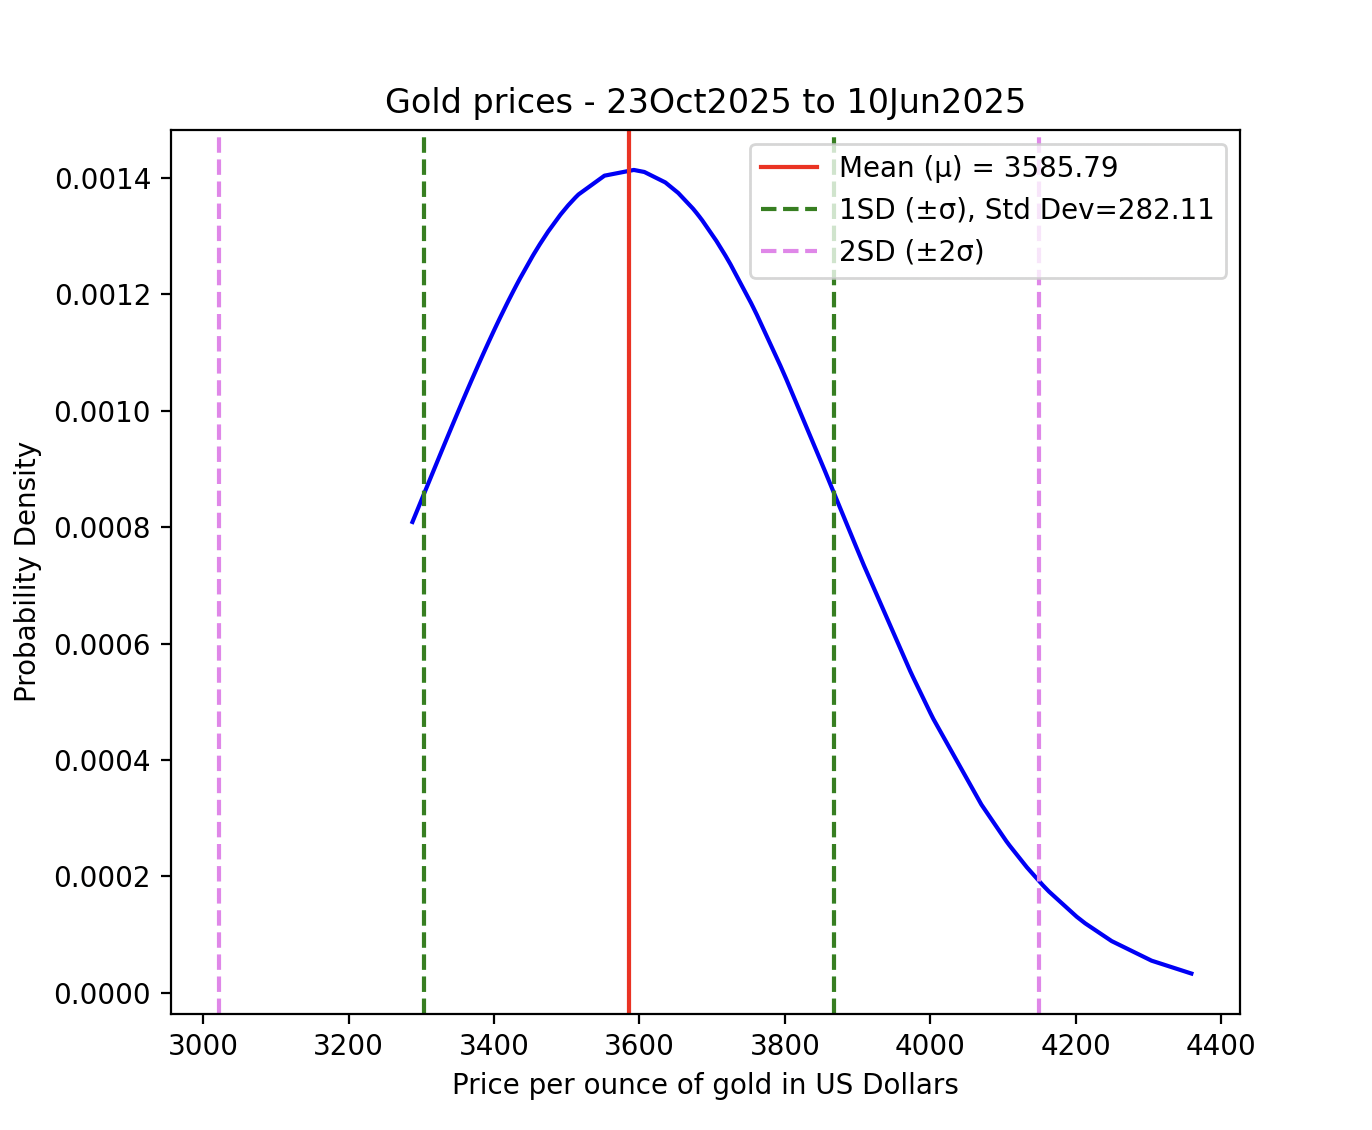
# Example Python program that creates a normal curve # 100 days gold prices per ounce goldPrices = np.sort(goldPrices) # Compute the probability distribution function of the normal distribution # Plot the normal curve # Draw vertical on both sides of the mean # Draw vertical on both sides of the mean # Give a title # Display the legends # Display the plot |
Output:
Kurtosis:
0.07
Example 3:
The Fisher’s Kurtosis value found for the pandas.Series instance in this example is less than 0 and hence the distribution present in the Series is Platykurtic.
|
# Python example program to compute kurtosis of # the distribution represented by a pandas.Series import pandas as pds
# Values of a distribution vals = [2,2.2,2.3,2.1,1.9,2.3]
# Create pandas.Series instance series = pds.Series(vals)
print("Kurtosis:") print(round(series.kurtosis(), 2)) |
Output:
|
Kurtosis: -1.48 |