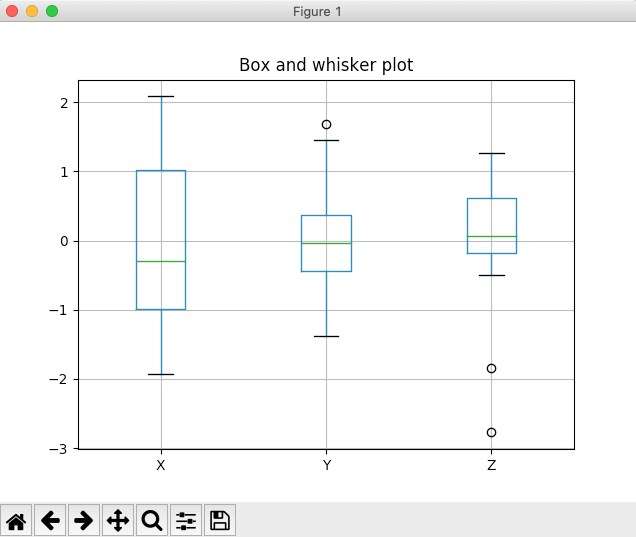
Overview:
- A box plot provides a quartile-based view of the data.
- A box plot is drawn using a box with boundaries of the box at lower quartile and upper quartile of the distribution. The median value is marked inside the box.
- Two whiskers are extended from the box boundaries - one from the lower quartile boundary to the lowest value of the distribution and another from the upper quartile boundary to the highest value of the distribution.
- A box plot is also called as a box and whisker plot.
- The outliers of the distribution are marked separately as points, circles or bubbles.
|
Quartiles of a Distribution: A quartile divides the distribution into four parts or four quarters. The division is based on three points: a lower quartile, median, and upper quartile. Lower Quartile: It is the middle point between the lowest value of the distribution and the median value of the distribution. Median: A median value is the value of the element at the middle position of the distribution. For even number sized distributions the median is calculated by taking the mean of the two central values. Upper Quartile: The upper quartile is the middle point between the median and the highest value of the distribution. |
Plotting a Box plot using pandas DataFrame:
- Calling the box() method on the DataFrame plot member, draws a box and whisker plot.
- The keyword arguments that can be passed to the DataFrame.plot() method can be passed to the box() method to customize the plot.E.g., title, grid.
- In the similar way a box plot can be drawn using matplotlib and ndarrays directly.
Example:
|
# Example Python program to draw a box whisker plot # using pandas DataFrame import pandas as pd import numpy as np import matplotlib.pyplot as plot
# Create an ndarray with three columns and 20 rows data = np.random.randn(20, 3);
# Create a DataFrame using the ndarray df = pd.DataFrame(data, columns=list('XYZ'));
# Draw box plots considering each column of the pandas # DataFrame as a distribution df.plot.box(title="Box and whisker plot", grid=True); plot.show(block=True); |
Output:
