Overview:
- Fourier transform is one of the most applied concepts in the world of Science and Digital Signal Processing.
- Fourier transform provides the frequency domain representation of the original signal.
- For example, given a sinusoidal signal which is in time domain the Fourier Transform provides the constituent signal frequencies.
- Using Fourier transform both periodic and non-periodic signals can be transformed from time domain to frequency domain.
Example:
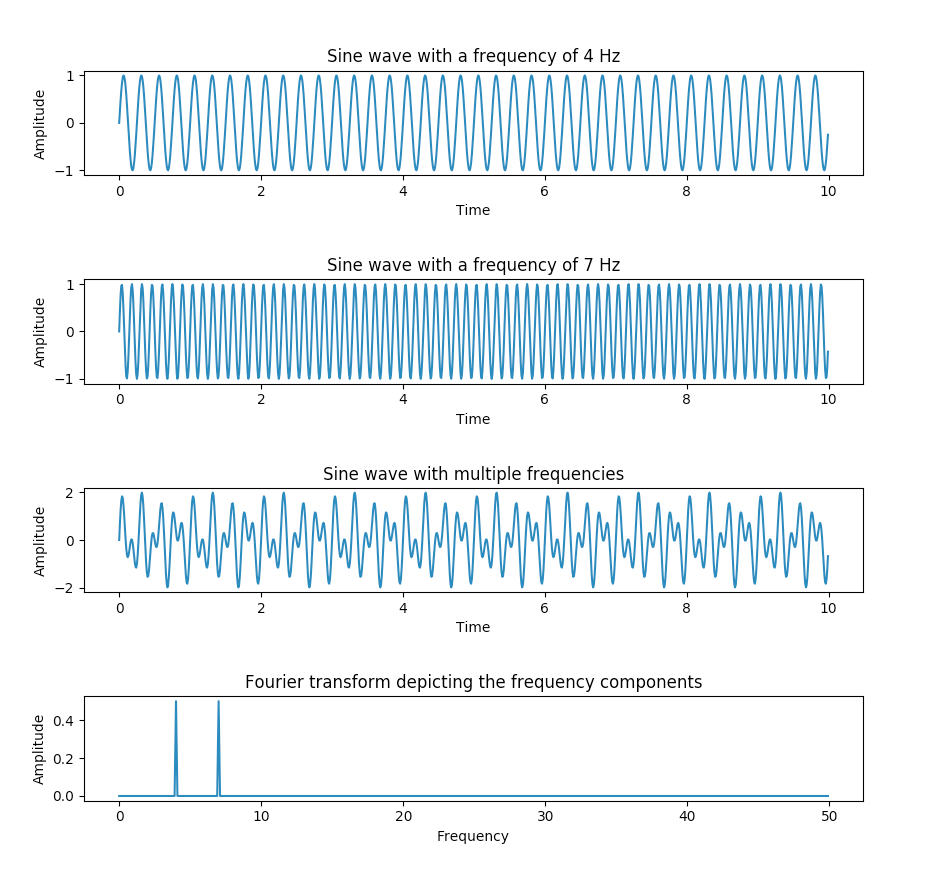
The Python example creates two sine waves and they are added together to create one signal. When the Fourier transform is applied to the resultant signal it provides the frequency components present in the sine wave.
|
# Python example - Fourier transform using numpy.fft method import numpy as np import matplotlib.pyplot as plotter
# How many time points are needed i,e., Sampling Frequency samplingFrequency = 100;
# At what intervals time points are sampled samplingInterval = 1 / samplingFrequency;
# Begin time period of the signals beginTime = 0;
# End time period of the signals endTime = 10;
# Frequency of the signals signal1Frequency = 4; signal2Frequency = 7;
# Time points time = np.arange(beginTime, endTime, samplingInterval);
# Create two sine waves amplitude1 = np.sin(2*np.pi*signal1Frequency*time) amplitude2 = np.sin(2*np.pi*signal2Frequency*time)
# Create subplot figure, axis = plotter.subplots(4, 1) plotter.subplots_adjust(hspace=1)
# Time domain representation for sine wave 1 axis[0].set_title('Sine wave with a frequency of 4 Hz') axis[0].plot(time, amplitude1) axis[0].set_xlabel('Time') axis[0].set_ylabel('Amplitude')
# Time domain representation for sine wave 2 axis[1].set_title('Sine wave with a frequency of 7 Hz') axis[1].plot(time, amplitude2) axis[1].set_xlabel('Time') axis[1].set_ylabel('Amplitude')
# Add the sine waves amplitude = amplitude1 + amplitude2
# Time domain representation of the resultant sine wave axis[2].set_title('Sine wave with multiple frequencies') axis[2].plot(time, amplitude) axis[2].set_xlabel('Time') axis[2].set_ylabel('Amplitude')
# Frequency domain representation fourierTransform = np.fft.fft(amplitude)/len(amplitude) # Normalize amplitude fourierTransform = fourierTransform[range(int(len(amplitude)/2))] # Exclude sampling frequency
tpCount = len(amplitude) values = np.arange(int(tpCount/2)) timePeriod = tpCount/samplingFrequency frequencies = values/timePeriod
# Frequency domain representation axis[3].set_title('Fourier transform depicting the frequency components')
axis[3].plot(frequencies, abs(fourierTransform)) axis[3].set_xlabel('Frequency') axis[3].set_ylabel('Amplitude')
plotter.show() |
Output: