Overview:
Before going to plot coherence between two signals let us do some recap required for definitions in Digital Signal Processing.
Signals represent information and systems process them. Signals carry information, energy and so on. A signal is a function of some variable, which is described over time, space, or some other variable.
Examples of Signals:
- Sunrise, sunset and the sunlight are signals received by birds, animals and human beings and they take some action like waking up in the morning, eating and sleeping.
- A car turning on a curve flashing the blinkers either on the right or left hand side
- Varying of voltage over a time period

Courtesy: Andrew
Coherence in Digital Signal Processing:
- Coherence is a measure used for comparing the relation between two signals. It is based on the correlation between two signals.
- Coherence measures the normalized correlation between two power spectra. A power spectra tells how much of the power energy is contained in the frequency components of the signal.
Coherence is mathematically given by
Cxy(f) = |Gxy(f)|^2/Gxx(f)Gyy(f)
Gxy(f) - Cross Spectral Density of the signals x and y
Gxx(f)- Power Spectral density of signal x
Gyy(f)- Power Spectral density of y
- If coherence is 1 both the signals are fully in coherence that is if signal one is the input and signal two is the output, signal one can be characterized fully using signal 2. This is the ideal characteristic of a linear system.
- If coherence is less than 1 both the signals are in coherence + some noise.
- If coherence is zero the signals one and two are not related.
Plotting Coherence between two signals using Python and Matplotlib:
Pyplot module of Matplotlib library provides cohere() method, which calculates the coherence and the frequencies of the coherence vector.
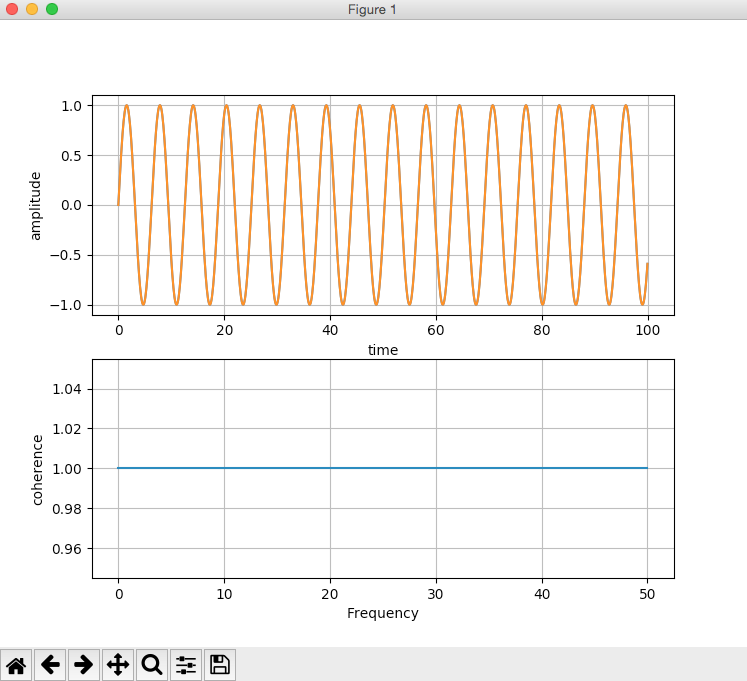
Example1: (Where Coherence =1,between the two signals)
The following python example creates two identical sine waves using matplotlib and calculates the coherence between them. Since both the signals are identical the coherence between the two signals is 1. The coherence value 1 is visualized as a straight line along the X-axis of the plot.
|
# import numpy and pyplot modules import numpy as np import matplotlib.pyplot as plot
# Create sine wave1 time = np.arange(0, 100, 0.1) sinewave1 = np.sin(time)
# Create sine wave2 as replica of sine wave1 time1 = np.arange(0, 100, 0.1) sinewave2 = np.sin(time1)
# Plot the sine waves - subplot 1 plot.title('Two sine waves with coherence as 1') plot.subplot(211) plot.grid(True, which='both') plot.xlabel('time') plot.ylabel('amplitude') plot.plot(time, sinewave1, time1, sinewave2)
# Plot the coherence - subplot 2 plot.subplot(212) coh, f = plot.cohere(sinewave1, sinewave2, 256, 1./.01) print("Coherence between two signals:") print(coh) print("Frequncies of the coherence vector:") print(f) plot.ylabel('coherence') plot.show() |
Output1: (Where Coherence =1,between the two signals):
|
Coherence between two signals: [ 1. 1. 1. 1. 1. 1. 1. 1. 1. 1. 1. 1. 1. 1. 1. 1. 1. 1. 1. 1. 1. 1. 1. 1. 1. 1. 1. 1. 1. 1. 1. 1. 1. 1. 1. 1. 1. 1. 1. 1. 1. 1. 1. 1. 1. 1. 1. 1. 1. 1. 1. 1. 1. 1. 1. 1. 1. 1. 1. 1. 1. 1. 1. 1. 1. 1. 1. 1. 1. 1. 1. 1. 1. 1. 1. 1. 1. 1. 1. 1. 1. 1. 1. 1. 1. 1. 1. 1. 1. 1. 1. 1. 1. 1. 1. 1. 1. 1. 1. 1. 1. 1. 1. 1. 1. 1. 1. 1. 1. 1. 1. 1. 1. 1. 1. 1. 1. 1. 1. 1. 1. 1. 1. 1. 1. 1. 1. 1. 1.] Frequencies of the coherence vector: [ 0. 0.390625 0.78125 1.171875 1.5625 1.953125 2.34375 2.734375 3.125 3.515625 3.90625 4.296875 4.6875 5.078125 5.46875 5.859375 6.25 6.640625 7.03125 7.421875 7.8125 8.203125 8.59375 8.984375 9.375 9.765625 10.15625 10.546875 10.9375 11.328125 11.71875 12.109375 12.5 12.890625 13.28125 13.671875 14.0625 14.453125 14.84375 15.234375 15.625 16.015625 16.40625 16.796875 17.1875 17.578125 17.96875 18.359375 18.75 19.140625 19.53125 19.921875 20.3125 20.703125 21.09375 21.484375 21.875 22.265625 22.65625 23.046875 23.4375 23.828125 24.21875 24.609375 25. 25.390625 25.78125 26.171875 26.5625 26.953125 27.34375 27.734375 28.125 28.515625 28.90625 29.296875 29.6875 30.078125 30.46875 30.859375 31.25 31.640625 32.03125 32.421875 32.8125 33.203125 33.59375 33.984375 34.375 34.765625 35.15625 35.546875 35.9375 36.328125 36.71875 37.109375 37.5 37.890625 38.28125 38.671875 39.0625 39.453125 39.84375 40.234375 40.625 41.015625 41.40625 41.796875 42.1875 42.578125 42.96875 43.359375 43.75 44.140625 44.53125 44.921875 45.3125 45.703125 46.09375 46.484375 46.875 47.265625 47.65625 48.046875 48.4375 48.828125 49.21875 49.609375 50. ] |
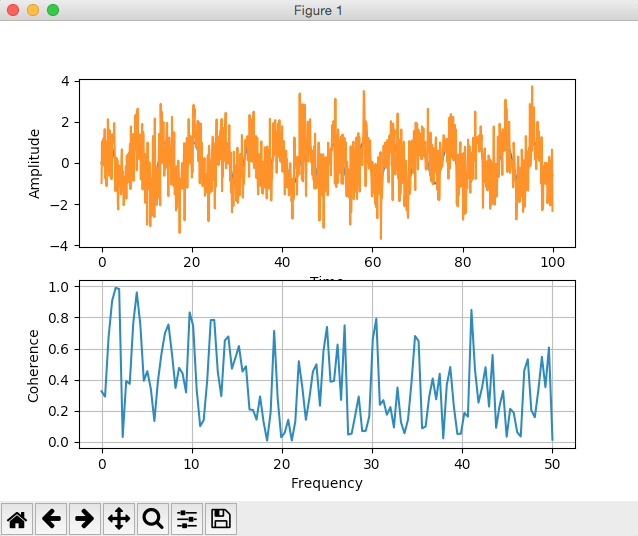
Example2: (Where Coherence < 1,between the two signals):
|
#import numpy and pyplot import numpy as np import matplotlib.pyplot as plot
# Get x values of the sine wave one time = np.arange(0, 100, 0.1);
# Create sine wave one sinewave1 = np.sin(time)
# Get x values of the sine wave two time1 = np.arange(0, 100, 0.1);
# Create sine wave two sinewave2 = np.sin(time1) + np.random.randn(len(time1)) # add white noise to the signal
# Plot the sine waves plot.subplot(211) plot.xlabel("Time") plot.ylabel("Amplitude") plot.plot(time, sinewave1, time1, sinewave2)
plot.subplot(212) coh, f = plot.cohere(sinewave1, sinewave2, 256, 1./.01)
print("Coherence between the sine wave one and sine wave two:") print(coh)
print("Frequency vector:") print(f)
plot.xlabel('Frequency') plot.ylabel('Coherence') plot.show() |
Output2: (Where Coherence < 1,between the two signals):
- In example2 we have introduced white noise.
- The coherence values between the signal1 and signal2 are given here. The coherence values are less than one but greater than zero, which means the two signals – sign wave1 and sign wave2 are coherent, but not fully. The noise present in signal2 prevents us describe the signal1 fully in terms of signal2.
|
Coherence between the sine wave one and sine wave two: [ 0.32468261 0.29048112 0.6742881 0.90664218 0.99080677 0.98326528 0.03054029 0.39089757 0.37261148 0.76272111 0.96162723 0.75703402 0.39236145 0.45448182 0.33928063 0.133061 0.38922675 0.56463312 0.69878137 0.75483307 0.56327037 0.34606935 0.47585059 0.44014512 0.31727541 0.83267451 0.74711271 0.33736817 0.10024564 0.1394823 0.39596828 0.78368179 0.78405942 0.44949323 0.29349927 0.65211104 0.67787445 0.47020952 0.54027687 0.61634338 0.45184892 0.48577513 0.20729735 0.20482254 0.14241289 0.29173771 0.12684244 0.00758156 0.18933596 0.71362819 0.27851464 0.02872453 0.05843246 0.14154921 0.00777536 0.12888692 0.51855754 0.34939773 0.1416513 0.28053583 0.45158895 0.49850282 0.23170471 0.58504021 0.73921409 0.38627158 0.3918108 0.62565787 0.26903731 0.7495451 0.04623494 0.05255391 0.16883985 0.29124716 0.06835 0.07024807 0.16421559 0.66011261 0.79270229 0.23755552 0.2678224 0.1737412 0.22326423 0.09187296 0.349182 0.1253156 0.05452957 0.14229612 0.38483263 0.68075285 0.64764936 0.08630145 0.09837388 0.28872958 0.40759757 0.27310724 0.43783911 0.02144801 0.36593274 0.48107479 0.22854087 0.05025897 0.05140727 0.18605392 0.16155378 0.84900671 0.46646439 0.25157826 0.34727315 0.4801423 0.2262376 0.5587727 0.09000678 0.23270016 0.32704345 0.03202457 0.21167854 0.18721209 0.0609601 0.033863 0.45909516 0.53117697 0.20262965 0.15782563 0.33278989 0.54651145 0.35119042 0.60685768 0.01307827] |
|
|
|
Frequency vector: [ 0. 0.390625 0.78125 1.171875 1.5625 1.953125 2.34375 2.734375 3.125 3.515625 3.90625 4.296875 4.6875 5.078125 5.46875 5.859375 6.25 6.640625 7.03125 7.421875 7.8125 8.203125 8.59375 8.984375 9.375 9.765625 10.15625 10.546875 10.9375 11.328125 11.71875 12.109375 12.5 12.890625 13.28125 13.671875 14.0625 14.453125 14.84375 15.234375 15.625 16.015625 16.40625 16.796875 17.1875 17.578125 17.96875 18.359375 18.75 19.140625 19.53125 19.921875 20.3125 20.703125 21.09375 21.484375 21.875 22.265625 22.65625 23.046875 23.4375 23.828125 24.21875 24.609375 25. 25.390625 25.78125 26.171875 26.5625 26.953125 27.34375 27.734375 28.125 28.515625 28.90625 29.296875 29.6875 30.078125 30.46875 30.859375 31.25 31.640625 32.03125 32.421875 32.8125 33.203125 33.59375 33.984375 34.375 34.765625 35.15625 35.546875 35.9375 36.328125 36.71875 37.109375 37.5 37.890625 38.28125 38.671875 39.0625 39.453125 39.84375 40.234375 40.625 41.015625 41.40625 41.796875 42.1875 42.578125 42.96875 43.359375 43.75 44.140625 44.53125 44.921875 45.3125 45.703125 46.09375 46.484375 46.875 47.265625 47.65625 48.046875 48.4375 48.828125 49.21875 49.609375 50. ] |