Overview
- Sine waves represent periodic oscillations.
- Sine waves have the shape of sine curve.
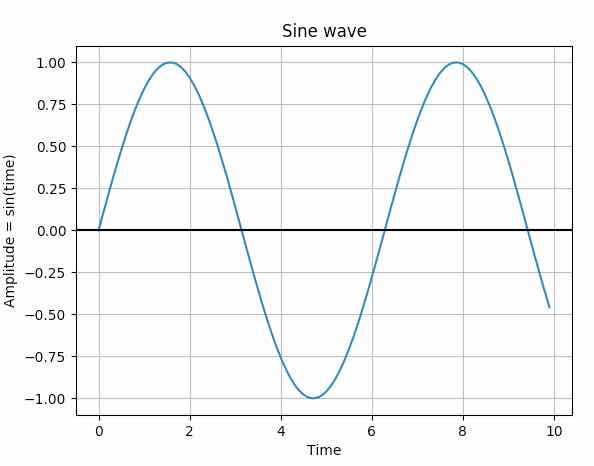
- The X-axis of the sine curve represents the time.
- The Y-axis of the sine curve represents the amplitude of the sine wave.
- The amplitude of the sine wave at any point in Y is proportional to the sine of a variable.
- The sine wave is given by the equation
A sin(ωt)
A - Amplitude
t - Time
ω (Omega) - Frequency
- The sine curve goes through origin.
- A cycle of sine wave is complete when the position of the sine wave starts from a position and comes to the same position after attaining its maximum and minimum amplitude during its course.
- The time taken to complete one cycle is called the period of the sine wave.
- The frequency of the sine wave is given by number of cycles per second.
- ‘A’ denotes amplitude of a sine wave.
- The distance covered by a cycle measures the wavelength of the sine wave.
- The wavelength of the sine wave is denoted by λ.
- Examples of sine waves include the oscillations produced by the suspended weight on spring and the alternating current.
- NumPy has the sin() function, which takes an array of values and provides the sine value for them.
- Using the numpy sin() function and the matplotlib plot()a sine wave can be drawn.
Example:
|
import numpy as np import matplotlib.pyplot as plot
# Get x values of the sine wave time = np.arange(0, 10, 0.1);
# Amplitude of the sine wave is sine of a variable like time amplitude = np.sin(time)
# Plot a sine wave using time and amplitude obtained for the sine wave plot.plot(time, amplitude)
# Give a title for the sine wave plot plot.title('Sine wave')
# Give x axis label for the sine wave plot plot.xlabel('Time')
# Give y axis label for the sine wave plot plot.ylabel('Amplitude = sin(time)')
plot.grid(True, which='both')
plot.axhline(y=0, color='k')
plot.show()
# Display the sine wave plot.show() |
Output:
