Overview:
- Auto correlation measures a set of current values against a set of past values and finds whether they correlate.
- Auto correlation is the correlation of one time series data to another time series data which has a time lag.
- Auto correlation varies from +1 to -1
- An auto correlation of +1 indicates that if the time series one increases in value the time series 2 also increases in proportion to the change in time series 1.
- An auto correlation of -1 indicates that if the time series one increases in value the time series 2 decreases in proportion to the change in time series 1.
- Auto correlation has its applications in signal processing, technical analysis of stocks and so on.
Example:
|
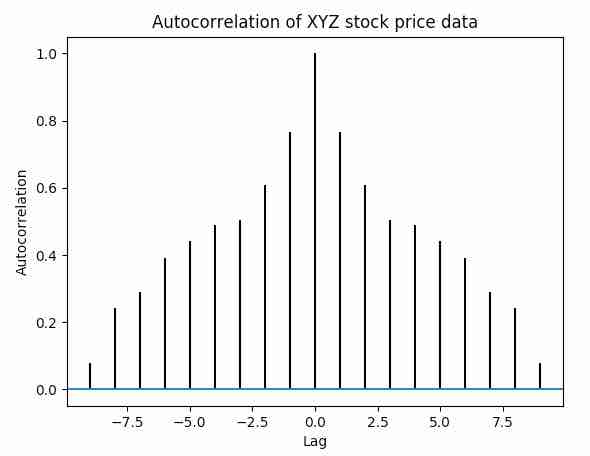
import matplotlib.pyplot as plot import numpy as np
# Time series data data = np.array([24.40,10.25,20.05,22.00,16.90,7.80,15.00,22.80,34.90,13.30])
# Plot autocorrelation plot.acorr(data, maxlags=9)
# Add labels to autocorrelation plot plot.title('Autocorrelation of XYZ stock price data') plot.xlabel('Lag') plot.ylabel('Autocorrelation')
# Display the autocorrelation plot plot.show() |
Output: