Overview:
- A Spike raster plot is a plot used in neuroscience to study the neural responses.
- Neurons generate spikes or action potentials in response to various stimuli.
- The Spike raster plot marks the neural activity - either a spike or an action potential from a neuron at a specified position.
- The Y-axis of the spike raster plot can represent either a neuron or a trial number of the experiment on a specific neuron.
- The X-axis of the spike raster plot represents the spike.
- The eventplot() function matplotlib.pyplot module marks lines at specified locations.
- If the orientation of the plot is horizontal the lines drawn are vertical lines.
- If the orientation of the plot is vertical the lines drawn are horizontal lines.
- The line drawn extends to both sides of the Y-axis or the X-axis (when orientation of the plot is vertical) with equal height or width.
- The size of the line is controlled by the linelengths parameter.
Example:
|
import matplotlib.pyplot as plot import numpy as np
# Set the random seed for data generation np.random.seed(2)
# Create rows of random data with 50 data points simulating rows of spike trains neuralData = np.random.random([8, 50])
# Set different colors for each neuron colorCodes = np.array([[0, 0, 0], [1, 0, 0], [0, 1, 0], [0, 0, 1], [1, 1, 0], [1, 0, 1], [0, 1, 1], [1, 0, 1]])
# Set spike colors for each neuron lineSize = [0.4, 0.3, 0.2, 0.8, 0.5, 0.6, 0.7, 0.9]
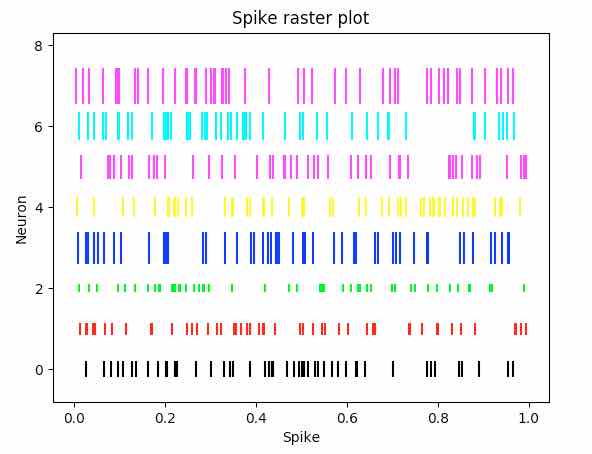
# Draw a spike raster plot plot.eventplot(neuralData, color=colorCodes, linelengths = lineSize)
# Provide the title for the spike raster plot plot.title('Spike raster plot')
# Give x axis label for the spike raster plot plot.xlabel('Neuron')
# Give y axis label for the spike raster plot plot.ylabel('Spike')
# Display the spike raster plot plot.show() |
Output: