Overview:
- Cosine waves are periodic waves generated out of oscillations.
- Cosine waves are similar to sine wave however the cosine wave leads sine wave by 90 degrees of phase angle.
- The cosine curve does not go through the origin.
- The cosine wave has the same frequency as its corresponding sine wave.
- The ocean tides are an example of cosine waves.
- A cosine curve can be plotted by calling the cosine() on a numpy array and using the plot() function of the pyplot module of matplotlib.
Example:
|
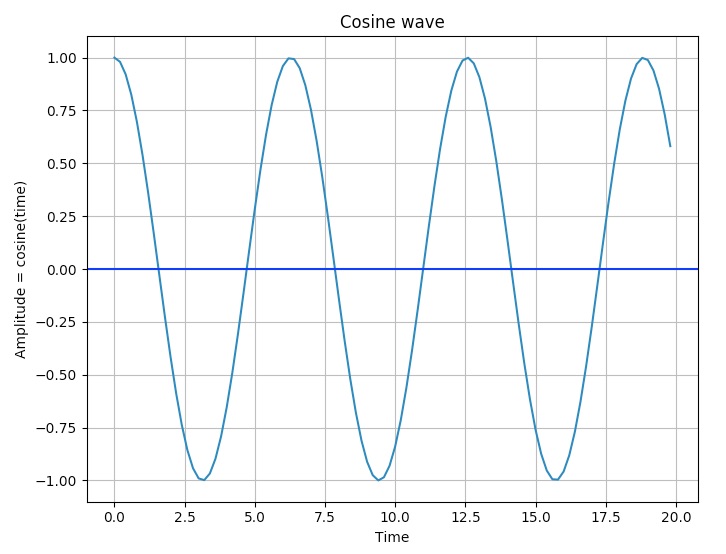
import numpy as np import matplotlib.pyplot as plot
# Get x values of the cosine wave time = np.arange(0, 20, 0.2);
# Amplitude of the cosine wave is cosine of a variable like time amplitude = np.cos(time)
# Plot a cosine wave using time and amplitude obtained for the cosine wave plot.plot(time, amplitude)
# Give a title for the cosine wave plot plot.title('Cosine wave')
# Give x axis label for the cosine wave plot plot.xlabel('Time')
# Give y axis label for the cosine wave plot plot.ylabel('Amplitude = cosine(time)')
# Draw the grid for the graph plot.grid(True, which='both')
plot.axhline(y=0, color='b')
# Display the cosine wave plot plot.show() |
Output: