Overview:
- Covariance describes how two variables are related. Covariance indicates the direction of the relationship between two variables.
- A positive value for the covariance indicates the variables have a linear relationship.
- A negative value for the covariance indicates the variables have an inverse relationship.
- Interpretation of the magnitude of the covariance is difficult as it is not a normalized value.
- The normalized value of the covariance is the correlation coefficient, which indicates both the direction as well as the strength of the relation between two variables.
- The value of covariance can be anything while the value of correlation coefficient varies between -1 and +1.
- Applications of covariance and correlation coefficient are almost countless. For example, As the inflation increases beyond certain levels the purchasing power of people decreases. Initial ages and the height of human beings have a relationship between them.They can be verified through covariance and correlation coefficient.
Covariance between the columns of a pandas DataFrame:
- The cov() method finds the covariance between the columns of a DataFrame instance.
Example1:
|
import pandas as pd
matrix = {"Var1":(20.0,20.5,21,21.5,22,22.5,23.5,24.5,23.5,22.5,21.5,21.0), "Var2":(1,2,3,4,5,6,7,8,9,10,11,12)};
dataFrame = pd.DataFrame(data=matrix); covariance = dataFrame.cov();
print("Set of variables:"); print(dataFrame);
print("Covariance:"); print(covariance); |
Output:

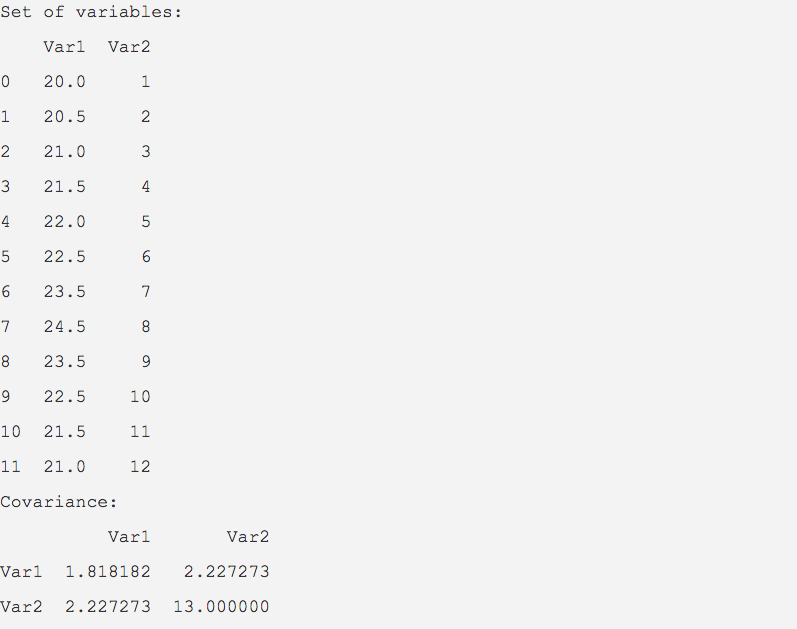
The covariance values are positive and hence the two variables var1 and var2 have a linear relationship.
Example2:
|
import pandas as pd
variableValues = [(60, 18000), (65, 18500), (70, 18250), (75, 18100), (80, 18200), (85, 18150), (90, 17000), (95, 16750), (100, 16000), (105, 15000), (110, 14000) ];
minPeriod = 10 dataFrame = pd.DataFrame(data=variableValues, columns=("a","b")); covariance = dataFrame.cov(min_periods=minPeriod);
print("Value for two sets of Variables:"); print(dataFrame);
print("Value of Covariance between the variables:"); print(covariance);
|
Output:

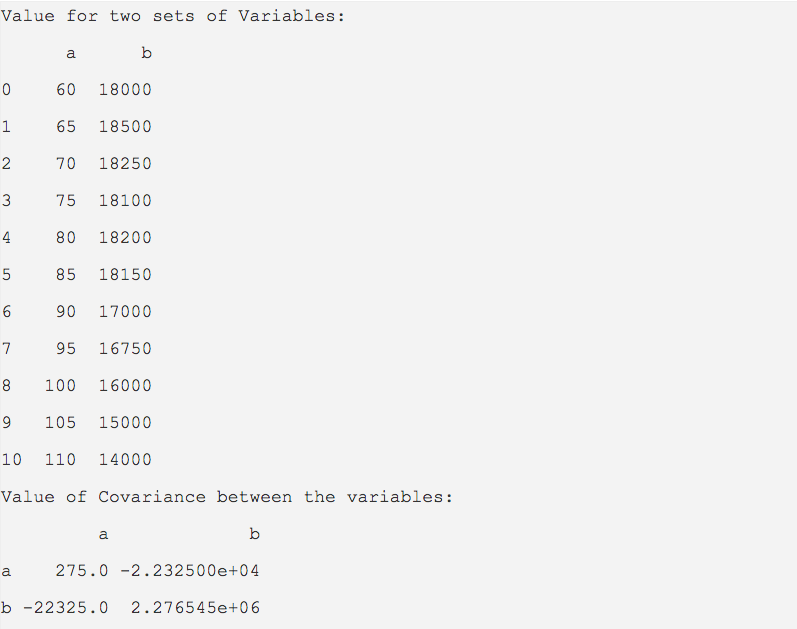
Since the covariance values are of opposite signs the variables are negatively related.