Overview:
- To understand a dataset better, we look into its values and try to identify what kind of values the data has. In other words we look into how the values are placed in a dataset, how centrally the values are located, how much variation the values of the dataset exhibit from the centrally located values.
- To find how centrally the values are located, the measures of central tendency need to be calculated. The measures of central tendency include mean, median and mode.
- To get the variation relative to the measures of central tendency the measures of dispersion need to be calculated. The measures of dispersion are variance and standard deviation.
Calculating measures of central tendency and measures of dispersion with pandas:
- Measures of central tendency and measures of dispersion can be calculated in two ways using pandas:
- Method one is to call the methods mean(), median(), mode() and methods var(), std() separately.
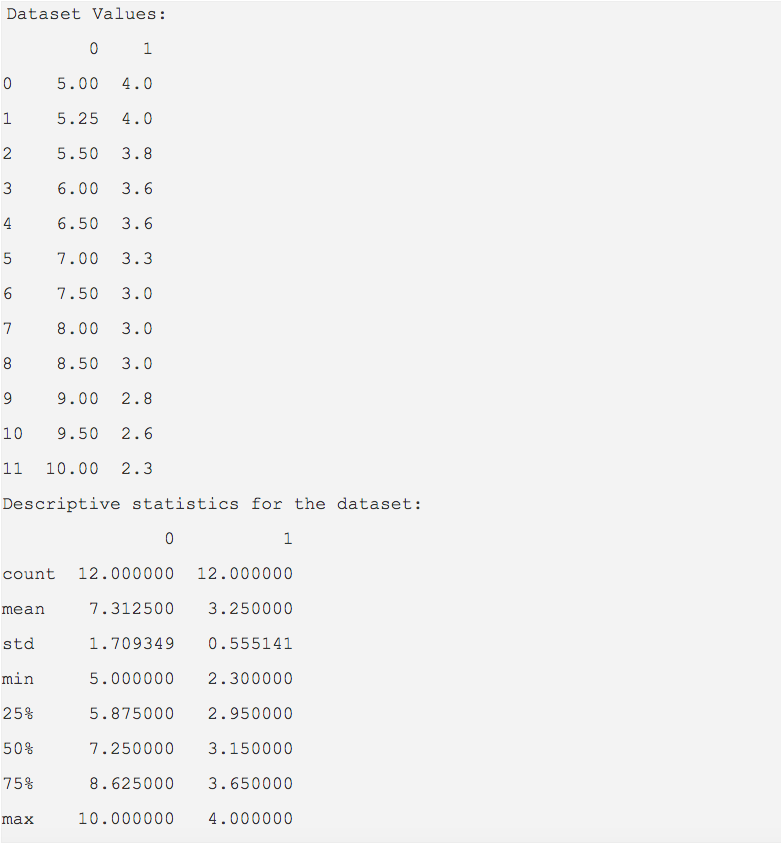
- Method two is to call the describe() method which provides all the descriptive statistics for the columns present in a pandas DataFrame instance.
Example:
|
import pandas as pd dataset = [(5.0,4), # Calculate descriptive statistics for the dataframe print("Descriptive statistics for the dataset:") |
Output: