Overview:
A class room of students can be grouped based on their height – students with height greater than 160 cm, 170 cm and so on. These measurements 160 cm, 170 cm and 180 cm divide a population into groups wherein the population of the group is of certain percentage of the whole. When this mechanism is applied to a probability distribution the locations that divide the distribution into groups are called quantiles. A quantile divides a group into 100 portions.
Popular quantiles:
Based on the percentage divide they create there are popular quantiles used in statistics. If a distribution is divided in to four groups consisting of below 25 percent, below 50 percent, below 75 percent and below 100 percent – these quantiles are called first quartile, second quantile, third quantile.
The Python example 1 loads the heights of students in a class into a pandas DataFrame and calculates the quartiles of the distribution. The quartiles are plot as given in the output below using matplotlib. When the quantiles are in the multiples of tens they are called deciles.
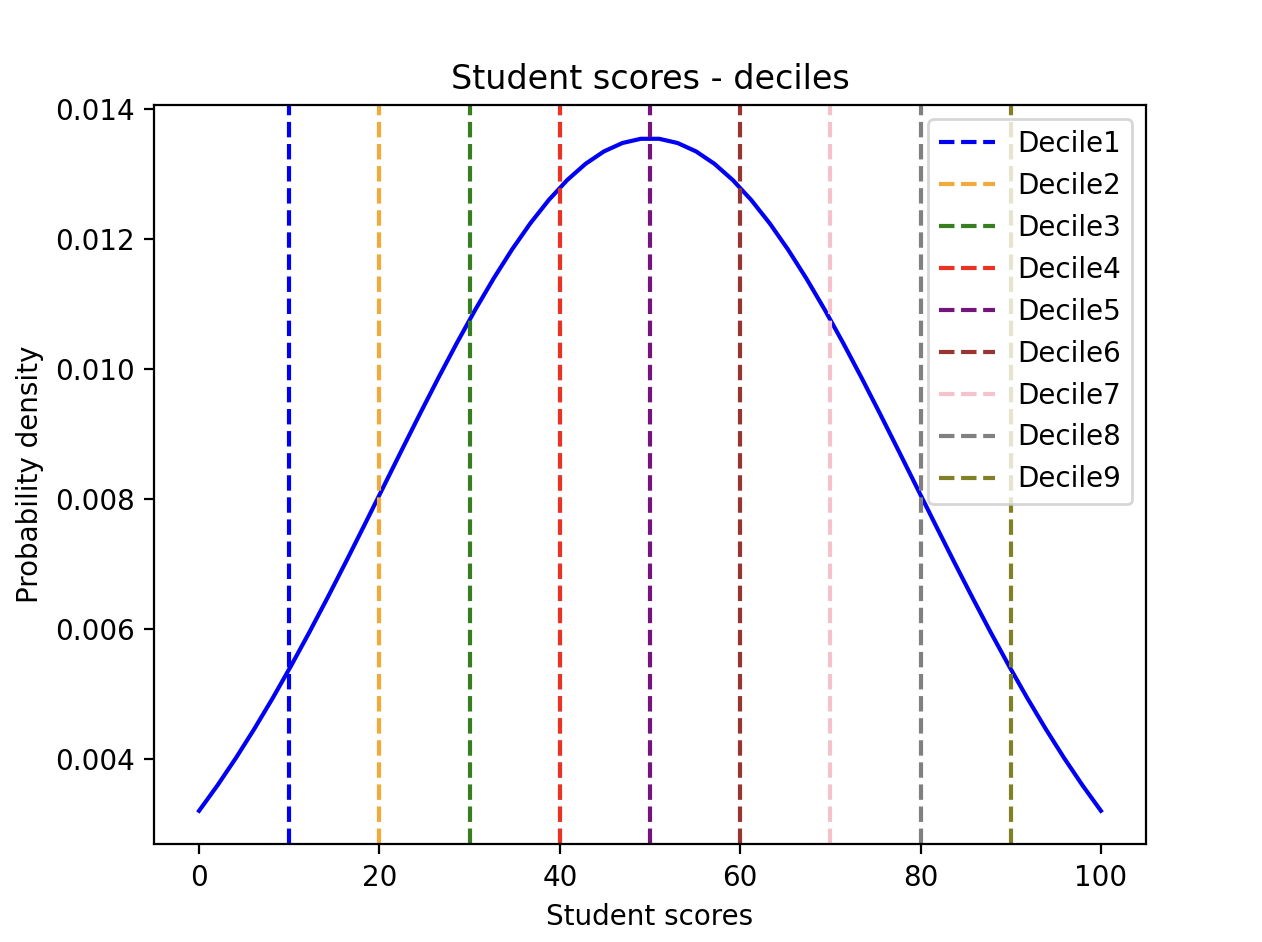
The quantile() function of Pandas DataFrame class computes the value below which a given portion of the data lies. The example 2 plots a normal distribution for a value of student scores and marks the deciles in the normal curve as given in the diagram below.
Example 1:
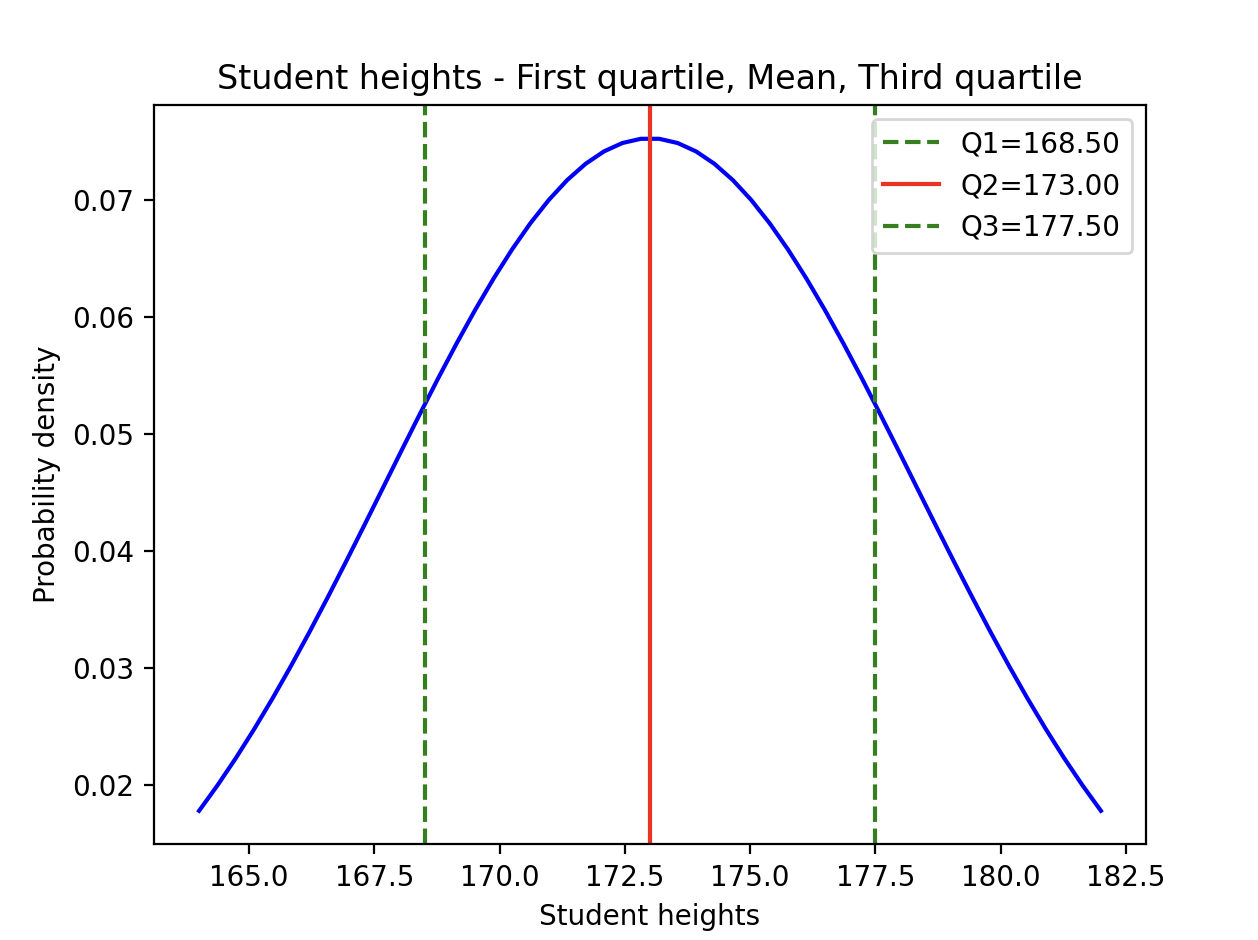
The Python example prints the heights of the students of a class at the first quartile (value at 25th percentile), at the second quartile(value at the 50th percentile) and at the third quartile (value at 75th percentile) and plots the heights using normal distribution.
|
# Example Python program that finds # Heights of students in a class # Load heights into DataFrame # Compute the 25th percentile # Compute the 50th percentile # Compute the 75th percentile print("First quartile:{:.2f}".format(q1[0])) # Find the standard deviation # Plot using the normal distribution plt.plot(heights, pd, color = 'blue') plt.axvline(q1[0], color='green', linestyle='--', label=f'Q1={q1[0]:.2f}') plt.title('Student heights - First quartile, Mean, Third quartile') plt.legend() |
Output:
| First quartile:168.50 Second quartile:173.00 Third quartile:177.50 Standard deviation:5.30 |
Example2 - Deciles marked on a normal curve:
|
# Example Python program that plots the deciles # Student test scores # Student scores loaded into a DataFrame fractions = np.arange(0.1, 1.0, 0.1) decile = int(round(dn[0])) decileLoc = int(round(i * 10)) # Find the standard deviation # Plot using the normal distribution plt.plot(scores, pd, color = 'blue') plt.title('Student scores - deciles') plt.legend() |
Output:
| Decile1 location:10 Decile2 location:20 Decile3 location:30 Decile4 location:40 Decile5 location:50 Decile6 location:60 Decile7 location:70 Decile8 location:80 Decile9 location:90 Standard deviation:29.45 |