Overview:
- In statistics, Kernel Density Estimation is a non-parametric technique that calculates and plots the probability distribution(the probability density) of a continuous random variable. i.e., The calculation does not assume the underlying data to be following the assumptions of a normal distribution or any distribution.
- In simple terms, Kernel Density Estimate is like a smoothened counterpart of a histogram without the line of histogram intervals and their end-points.
- Such a smoothened curve for the probability density of a given data is obtained by drawing individual estimates for the data points and summing them up to produce the final contour.
- The bandwidth 'h' used in the estimation plays a role in the level of smoothness of the estimated curve. The lower the 'h' - more closer to the data and more spiky the curve is. When the value of 'h' is higher the resultant curve is over smoothend.
KDE Plot in seaborn:
- Probablity Density Estimates can be drawn using any one of the kernel functions - as passed to the parameter "kernel" of the seaborn.kdeplot() function. By default, a Guassian kernel as denoted by the value "gau" is used. The kernels supported and the corresponding values are given here.
| Name of the kernel function | Value of the parameter |
| Guassian kernel | "gau" |
| Cosine | "cos" |
| Biweight | "bi" |
| Triweight | "trw" |
| Triangular | "tri" |
| Epanechnikov | "epa" |
- In seaborn the bandwidth of the KDE plot is controlled through the function parameter "bw".
Example:
|
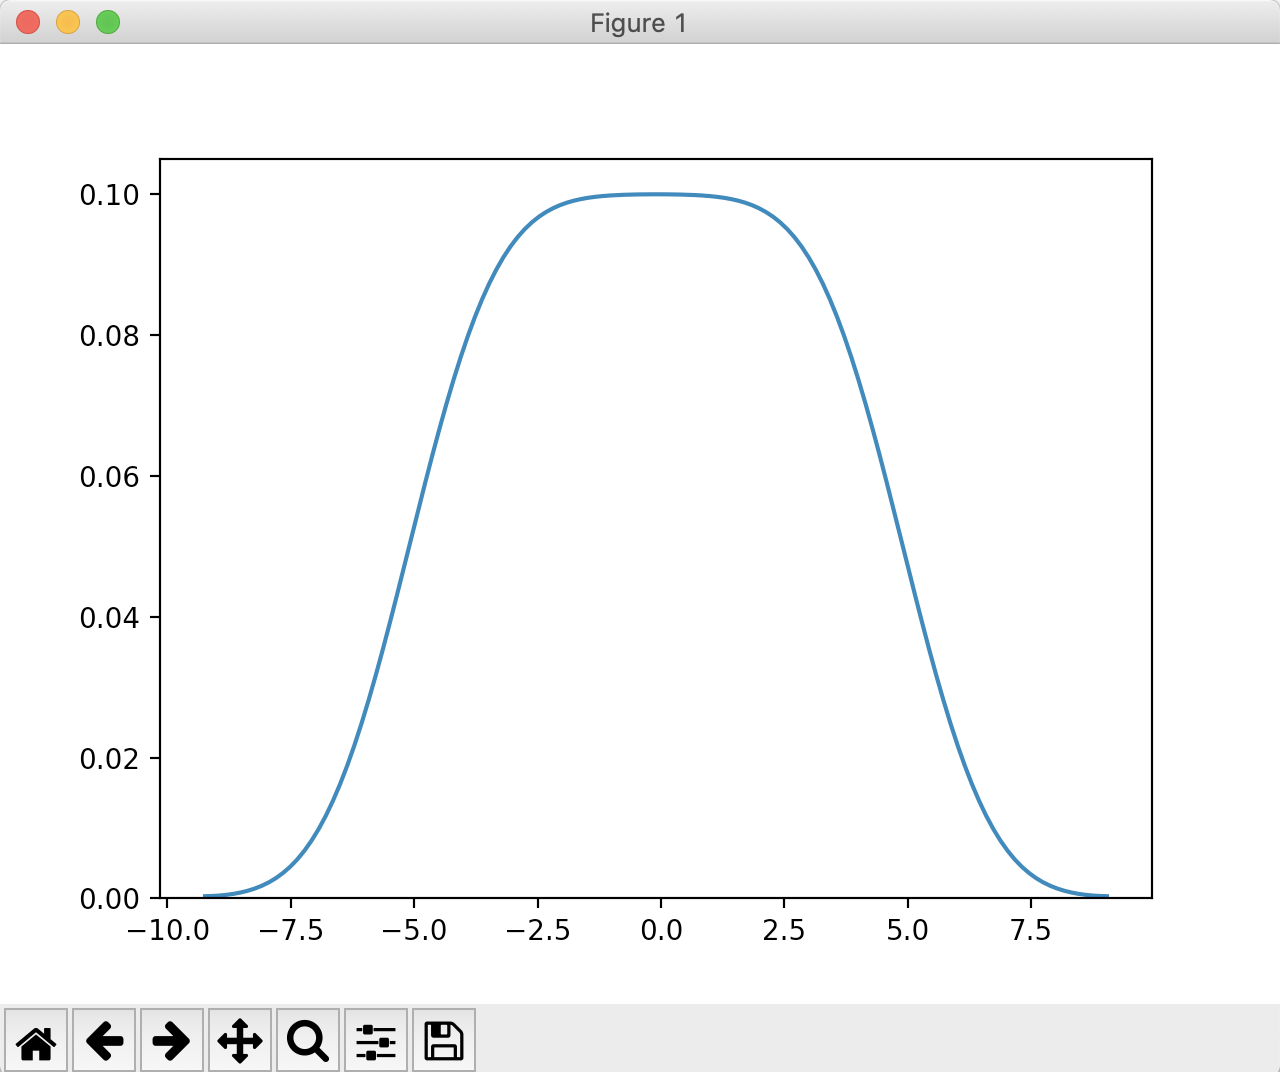
# Example Python program that draws a KDE plot # Generate data points # Use gaussian kernel to plot the Kernel Density Estimation |
Output:
