Overview:
- A scatter plot illustrates if there is any relationship between two variables.
- While both seaborn and matplotlib can be used to draw a scatter plot, the seaborn visualization is rich in terms of highlighting the subsets of the data points.
- The Seaborn data visualisation framework provides the function scatterplot() to draw a scatter plot. A basic scatter plot can be drawn using the scatter() function of the matplotlib library as well.
- The scatterplot() function from seaborn has parameters to distinguish datapoints using color(hue semantics), style and the size of the markers.
Example: A basic scatter plot using seaborn
|
# Example Python program that plots a scatter plot sns.set(style="whitegrid") df = pds.DataFrame(data=tempAndRain); sns.scatterplot(x="temperature", y="rainfall", data=df); |
Output:

Hue semantics for numeric Data:
The color of the scatter plot markers can be used to distinguish subsets of the data using
the hue parameter. In the above example Python code, changing of the scatterplot() function invocation with the hue parameter makes the scatterplot to appear as below.
Code Change:
| sns.scatterplot(x="temperature", y="rainfall", data=df, hue="rainfall"); |
Output:

Using the style parameter to distinguish the data:
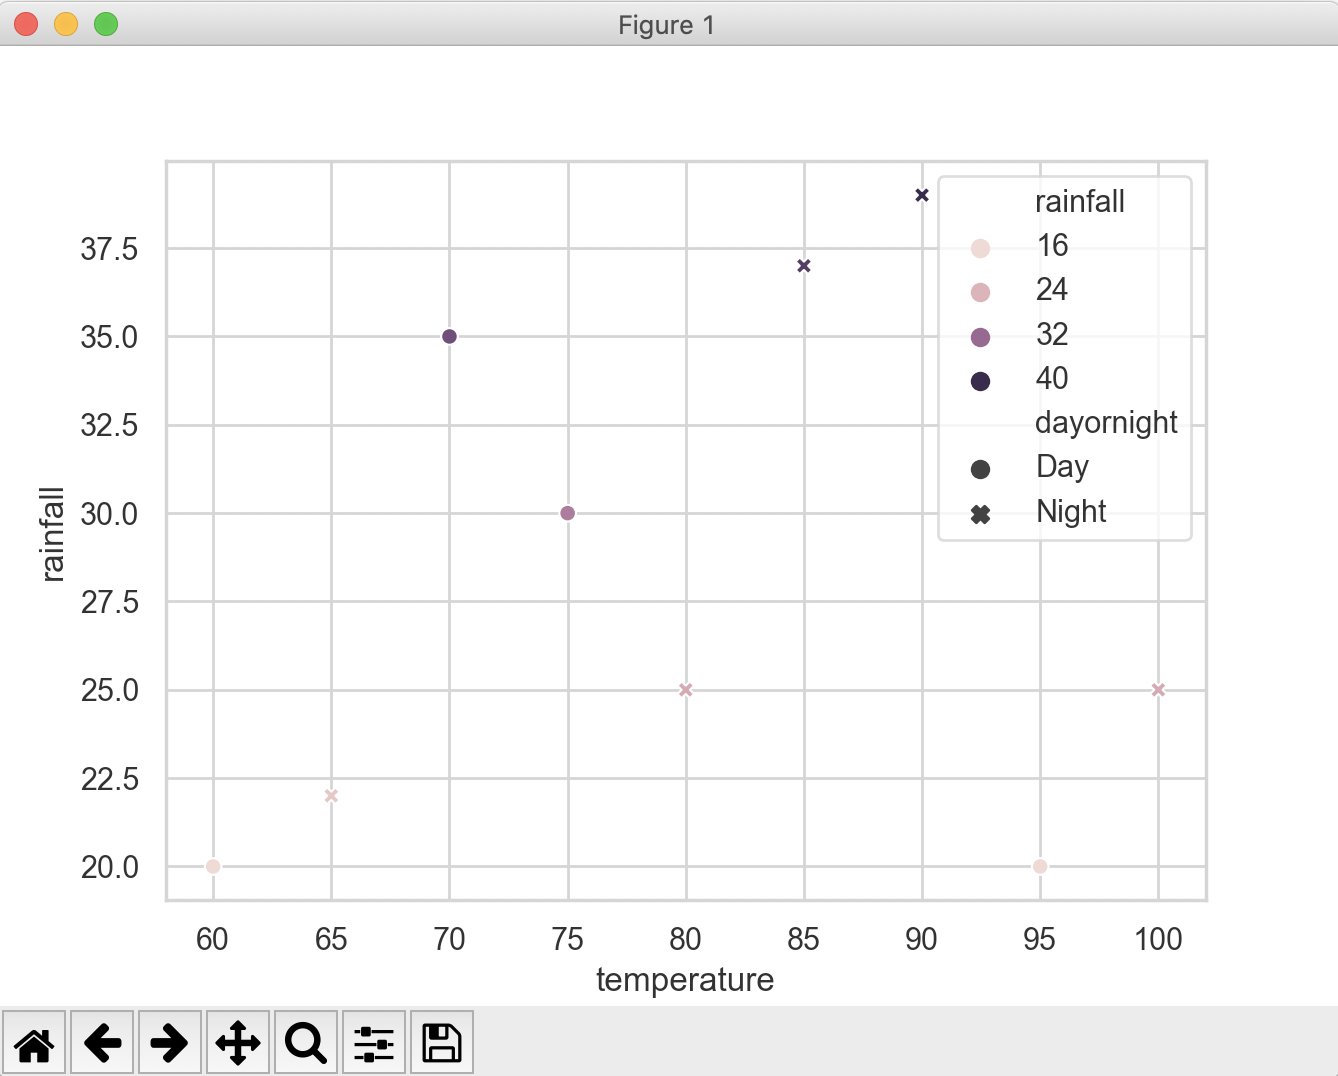
The marker style in the scatter plot can be used to further distinguish the data points. The example code below uses the style parameter to differentiate between night time data vs date time data.
Code Change:
| sns.scatterplot(x="temperature", y="rainfall", data=df, hue="rainfall", style="dayornight"); |
Output: