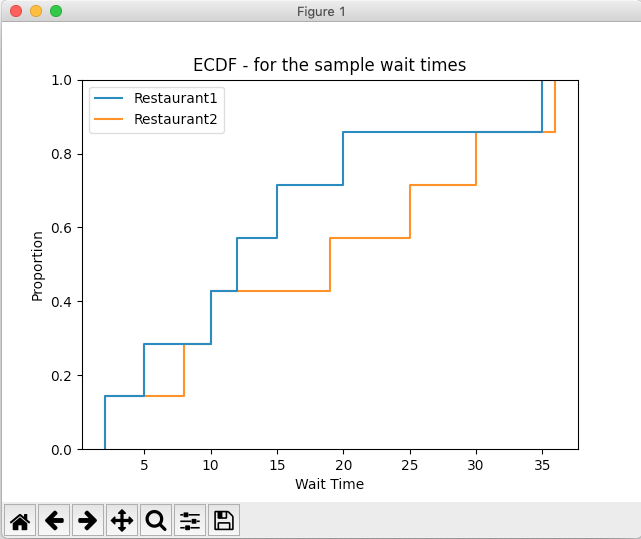
Overview:
- A Cumulative Distribution Function(CDF) returns the probabilities of a range of outcomes for a random variable either discrete or continuous.
- When the Cumulative Distribution Function describes probabilities of sample outcomes drawn from a population, it is called the Empirical Cumulative Distribution Function(ECDF).
- ECDF answers the following questions:
- What is the probability that outcome of a random variable(sample value from the population) is less than or equal to a certain value? The answer is to sum the probabilities of each individual outcome.
-
The Empirical Cumulative Probability Distribution function P(X) is given by
P(X)=p(x1)+p(x2)+⋯p(xn)
where x1, x2, xn-1 ≤ xn.
X – name of the random variable
x – value of the random variable or outcome from the sample
- In an ECDF plot, the Y axis denotes the probabilities. It also denotes the percentile values of the sample. For example, 0.2 in the Y axis refers to the 20th percentile of the probabilities. Correlating with the X axis one can get the individual probability of a certain outcome, as well as the cumulative probability of the outcome being less than or equal to that value.
- The function ecdfplot() of the seaborn library draws the ECDF plot for a given sample data.
Example:
|
# Example Python program that plots the import seaborn as sns # Restaurants and their Sample wait times # Draw the ECDF plot (a.k.a, Step Plot) plt.xlabel('Wait Time'); |
Output:
