Drawing A Rugplot Using Python And Seaborn

Overview:

  •  The rugplot() function of seaborn helps visualising data points by providing one more visual aid through ticks in X, Y axes and through the hue semantics of the ticks.

Example:

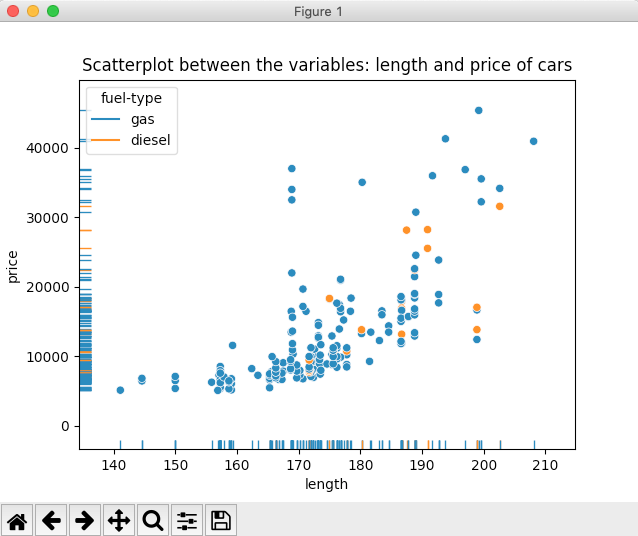
# Example Python program that creates a seaborn plot with 
# a rugplot
# Data Courtesy: https://archive.ics.uci.edu/ml/datasets/Automobile
import pandas as pds
import seaborn as sns
import matplotlib.pyplot as plt

# Import the Automobile Data Set into a DataFrame
carData = pds.read_csv('/Users/selvamvinod/Downloads/cardata.csv');
print(carData);

# Create a scatter plot
sns.scatterplot(x="length", y="price", data=carData, hue="fuel-type");

# Add ticks to the scatter plot axes
sns.rugplot(x="length", y="price", data=carData, hue="fuel-type");

plt.title("Scatterplot between the variables: length and price of cars");
plt.show();

Output:

symboling normalized-losses         make  ... city-mpg highway-mpg  price

0            3                 ?  alfa-romero  ...       21          27  13495

1            3                 ?  alfa-romero  ...       21          27  16500

2            1                 ?  alfa-romero  ...       19          26  16500

3            2               164         audi  ...       24          30  13950

4            2               164         audi  ...       18          22  17450

..         ...               ...          ...  ...      ...         ...    ...

196         -1                95        volvo  ...       23          28  16845

197         -1                95        volvo  ...       19          25  19045

198         -1                95        volvo  ...       18          23  21485

199         -1                95        volvo  ...       26          27  22470

200         -1                95        volvo  ...       19          25  22625


Drawing a rugplot using Python and seaborn


Copyright 2023 © pythontic.com