Overview:
- The function clustermap() in seaborn draws a hierarchically clustered heatmap.
- A clustered heatmap is different from an ordinary heatmap on the following terms:
- Clustered heatmaps are superior to ordinary heatmaps as the heatmap cells are arranged in clusters.These clusters are further complemented by the dendograms which provide a summary view of the clusters including the inter cluster distances.
- The seaborn visulaization library uses the the scipy function linkage() for transforming the raw data into a hierarchy of clusters.
- The scipy function linkage(), supports a variety of methods to decide which of the given two points should get into the cluster while iteratively computing the distance matrices. This can be any of the following: Nearest point Algorithm, Farthest Point Algorithm, WPGMA, Centroid, Median and Ward variance minimization, which can be selected through the "method" parameter of the clustermap() function.
- Just like adding a point to a cluster can be decided on maximum distance, minimum distance and others, the distance between two points itself can have different meanings. For seaborn and scipy the distance could be any of the following: Euclidean, minkowski, cityblock, seuclidean, sqeuclidean, cosine, correlation, hamming, jaccard, chebyshev, canberra, braycurtis , mahalanobis , yule, Dice, kulsinski, rogerstanimoto, russellrao, sokalmichener, sokalsneath and wminkowski distance. The distance semantics is controlled through the metric parameter of the seaborn function clustermap().
Example:
|
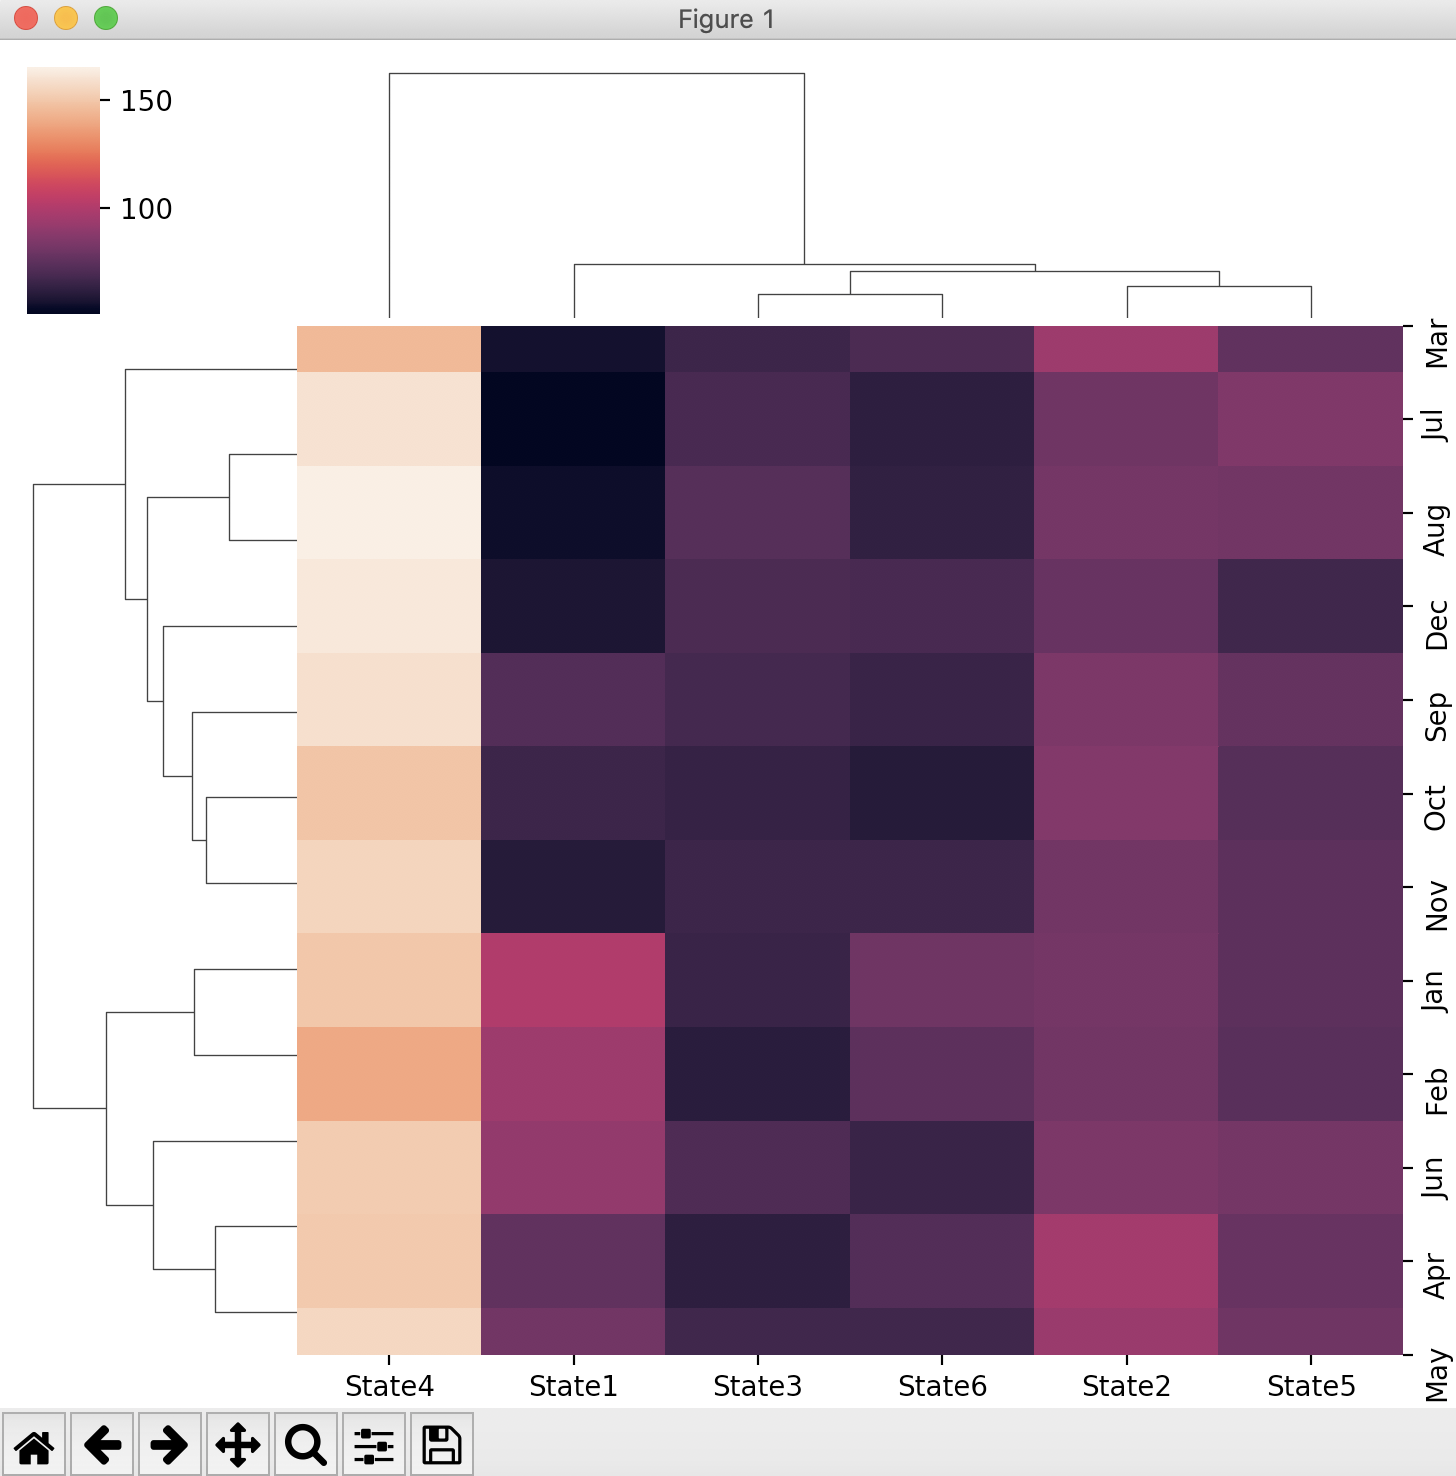
#Example Python program that creates a clustered heatmap using the Python #visualization library Seaborn # GDP data for six states for 12 months # Months # Python dictionary of states vs their GDPs # Create a pandas dataframe # Create a clustermap using seaborn |
Output: