Overview:
- Pillow - the Python Image Processing Library provides several methods to extract information pertaining to an image. The histogram() method provides information on counts of different colors/bands.
- histogram() method returns a list of pixel counts for each band present in the image. The list will have all the counts concatenated for each band.
- If an image is of mode "RGB" then for each of band/color a list of pixel counts will be returned, totaling 768.
- In other words, for an RGB image, the histogram() method gives information on how many kind of Red, Green and Blue pixels are present in the image for each 256 types of red, 256 types of green and 256 types of blue.
Example:
|
from PIL import Image import matplotlib.pyplot as plt
def getRed(redVal): return '#%02x%02x%02x' % (redVal, 0, 0)
def getGreen(greenVal): return '#%02x%02x%02x' % (0, greenVal, 0)
def getBlue(blueVal): return '#%02x%02x%02x' % (0, 0, blueVal)
# Create an Image with specific RGB value image = Image.open("./peacock.jpg")
# Modify the color of two pixels image.putpixel((0,1), (1,1,5)) image.putpixel((0,2), (2,1,5))
# Display the image image.show()
# Get the color histogram of the image histogram = image.histogram()
# Take only the Red counts l1 = histogram[0:256]
# Take only the Blue counts l2 = histogram[256:512]
# Take only the Green counts l3 = histogram[512:768]
plt.figure(0)
# R histogram for i in range(0, 256): plt.bar(i, l1[i], color = getRed(i), edgecolor=getRed(i), alpha=0.3)
# G histogram plt.figure(1) for i in range(0, 256): plt.bar(i, l2[i], color = getGreen(i), edgecolor=getGreen(i),alpha=0.3)
# B histogram plt.figure(2) for i in range(0, 256): plt.bar(i, l3[i], color = getBlue(i), edgecolor=getBlue(i),alpha=0.3)
plt.show() |
Output:
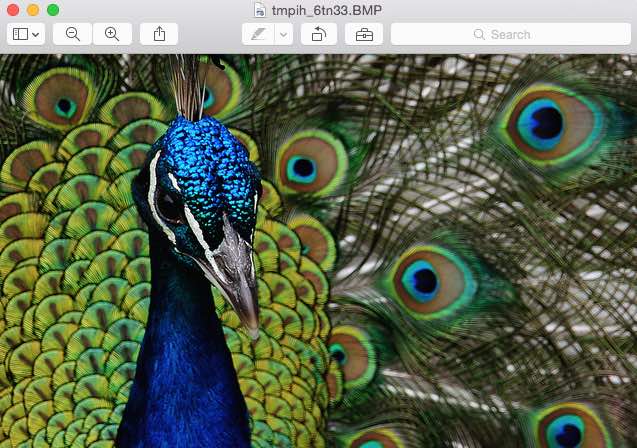
The image for which histogram is created:

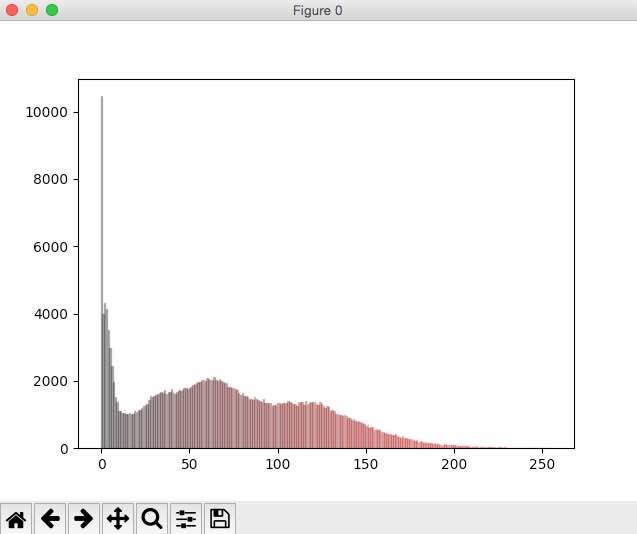
Histogram of red pixels:

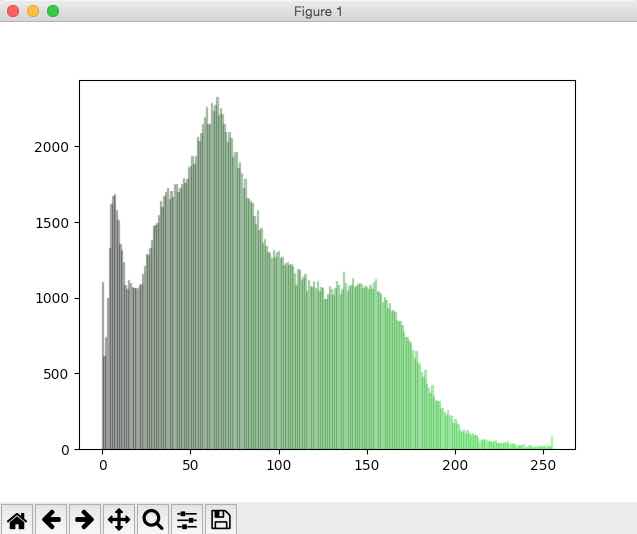
Histogram of green pixels:

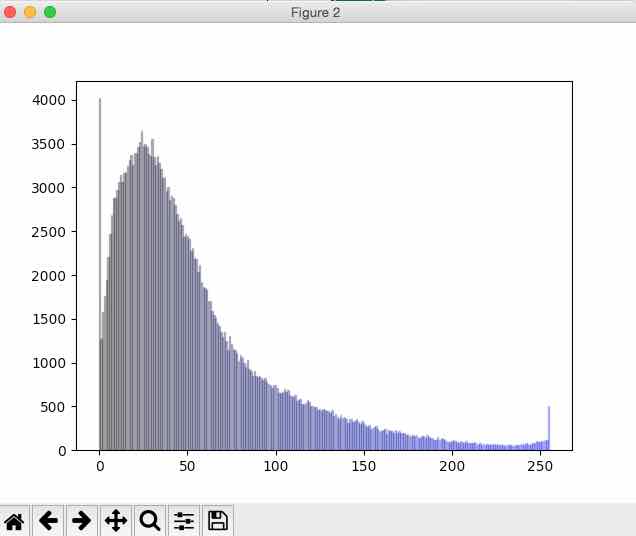
Histogram of blue pixels:
