Overview:
- A point in polar co-ordinates is represented as (r,Θ).
- The pair has a distance and angle – r for radius or distance from the origin and theta - Θ for the angle at which r has to be measured from origin.
- Polar co-ordinates and their modified counterparts are used in navigation, in describing the directionality of a microphone and in any system that is based on a central-point or origin.
- The pyplot module of Python Matplotlib provides the function polar which draws a polar plot.
- Remember, any mathematical function that can be plotted using the Cartesian coordinate system can be plotted using the polar co-ordinates as well.
Example1- Circle:
The python code below plots a circle using polar form. The equation of the circle in polar form is given by r = R.
|
# Example Python Program to plot a polar plot of a circle # import the numpy and pyplot modules plot.axes(projection='polar') # Set the title of the polar plot # Plot a circle with radius 2 using polar form for radian in rads: # Display the Polar plot |
Output1-Circle:

Example2-Cardioids-Symmetrical around x-axis:
- When the radii of two circles are equal, and when one circle is fixed and the other circle is rolling on the first one – a point on the rolling circle traced will plot a cardioid.
- The polar forms of the cardioids are given by:
r = a + bcos(k*Θ)
r = a + bsin(k*Θ)
For the equation, r = a + bcos(k*Θ),
- When a=1, b=1 and k=1, the cardioids are symmetrical around x-axis on the positive side.
- When a=-1, b=-1 and k=1, the cardioids are symmetrical around x-axis on the negative side.
|
# Example Python Program to plot Cardioids
# import the numpy and pyplot modules import numpy as np import matplotlib.pyplot as plot
fig = plot.figure() fig.add_subplot(211, projection='polar')
# Set the title of the polar plot plot.title('Cardioids in polar format:radius = a + (b*cos(k*radian))')
# Radian values upto 2*pi rads = np.arange(0, (2*np.pi), 0.01)
a = 1 b = 1 k = 1
# a = 1 and b = 1 for radian in rads: radius = a + (b*np.cos(k*radian)) # Plot in polar co-ordinates plot.polar(radian,radius,'o')
a = a+1 b = b+1 fig.add_subplot(212, projection='polar')
# a = 2 and b = 2 for radian in rads: radius = a + (b*np.cos(k*radian)) # Plot in polar co-ordinates plot.polar(radian,radius,'o')
# Display the Polar plot plot.show()
|
Output2-Cardioids-Symmetrical around x-axis:

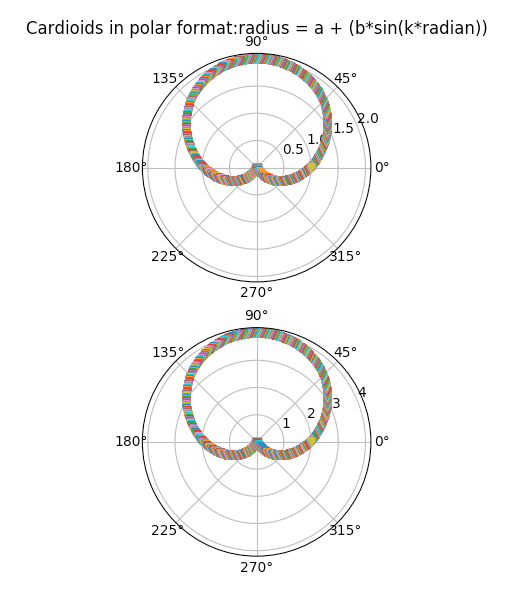
Example3-Cardioids-Symmetrical around y-axis:
|
# Example Python Program to plot Cardioids that are # symmetric around y axis
# import the numpy and pyplot modules import numpy as np import matplotlib.pyplot as plot
fig = plot.figure() fig.add_subplot(211, projection='polar')
# Set the title of the polar plot plot.title('Cardioids in polar format:radius = a + (b*sin(k*radian))')
# Radian values upto 2*pi rads = np.arange(0, (2*np.pi), 0.01)
a = 1 b = 1 k = 1
# a = -1 and b = -1 for radian in rads: radius = a + (b*np.sin(k*radian))
# Plot the cardioids in polar co-ordinates plot.polar(radian, radius, 'v')
a = a+1 b = b+1 fig.add_subplot(212, projection='polar')
# a = -2 and b = -2 for radian in rads: radius = a + (b*np.sin(k*radian)) # Plot in polar co-ordinates plot.polar(radian, radius,'v')
# Display the cardioids - plot.show() |
Example3-Cardioids-Symmetrical around y-axis:
Example4-n-leaf roses:
While keeping k > 1, and a=1,b=1,a=2,b=2 k-leaf roses are plotted.
|
# Example Python Program to plot Cardioids that are # symmetric around y axis
# import the numpy and pyplot modules import numpy as np import matplotlib.pyplot as plot
fig = plot.figure() fig.add_subplot(211, projection='polar')
# Set the title of the polar plot plot.title('k-leaf roses in polar format:radius = a + (b*cos(k*radian))')
# Radian values upto 2*pi rads = np.arange(0, (2*np.pi), 0.01)
a = 1 b = 1 k = 4
# a = -1 and b = -1 for radian in rads: radius = a + (b*np.cos(k*radian))
# Plot the cardioids in polar co-ordinates plot.polar(radian, radius, 'v')
a = a+1 b = b+1 k = 5 fig.add_subplot(212, projection='polar')
# a = -2 and b = -2 for radian in rads: radius = a + (b*np.cos(k*radian)) # Plot in polar co-ordinates plot.polar(radian, radius,'v')
# Display the cardioids - plot.show() |
Output5-n-leaf roses:
