Overview:
- A violin plot combines two aspects of a distribution in a single visualization:
- The features of a Box Plot: Median, Interquartile Distance
- The Probability Density Function
- In a violin plot, the Probability Density Function-PDF of the distribution is tilted side wards and placed on both the sides of the box plot.
- A violin plot clearly displays the multiple modes present in a multi-modal data.
- Violin plots display the whole distribution. They do not display outliers separately as in case of Box plots.
Drawing a violin plot using Python and Matplotlib:
- To create a violin plot, import the matplotlib.pyplot module and call the method violinplot() function by passing the data as sequences.
- The violin plot can be customized to display mean and median values.
- Using Matplotlib both vertical and horizontal violin plots can be created through the parameter vert. By default the value of the vert parameter is True, which creates a vertical violin plot. The width of the violin can be controlled by the widths parameter.
Example:
|
# Example python program to draw a violin plot using matplotlib import matplotlib.pyplot as plot import pandas as pd import numpy as np
# Customized method to draw violin plot in a matplotlib subplot def drawViolinPlot(axis, xlabel, xticks, xticklabels, ylabel, bandwidth, title): # Customize x-axis axis.set_xlabel(xlabel); axis.set_xticks(xticks); axis.set_xticklabels(xticklabels);
# Customize y-axis axis.set_ylabel(ylabel);
# Draw a violin plot for the distributions - Default bandwidth axis.violinplot(sequences, showmeans=True, showmedians=True, bw_method=bandwidth); axis.set_title(title);
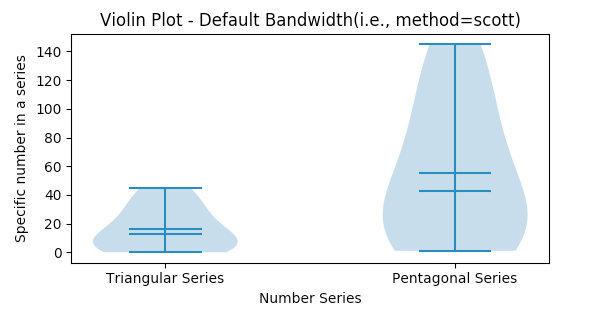
# Distributions as python lists triangularSeries = [0, 1, 3, 6, 10, 15, 21, 28, 36, 45]; pentagonalSeries = [1, 5, 12, 22, 35, 51, 70, 92, 117, 145];
# A tuple of distributions sequences = (triangularSeries, pentagonalSeries);
figure, axis = plot.subplots(2, 1); plot.subplots_adjust(hspace=1);
bandwidth = None; drawViolinPlot(axis[0], "Number Series", np.arange(len(sequences)+1), ('', 'Triangular Series', 'Pentagonal Series'), "Specific number in a series", bandwidth, "Violin Plot - Default Bandwidth(i.e., method=scott)");
bandwidth = 0.3; drawViolinPlot(axis[1], "Number Series", np.arange(len(sequences)+1), ('', 'Triangular Series', 'Pentagonal Series'), "Specific number in a series", bandwidth, "Violin Plot - Bandwidth=0.3(i.e., a scalar value)");
# Display violin plot plot.show(); |
Output: