Overview:
- Contour plot is a collection of contour lines.
- Each contour is a curve that is a resultant of cutting a surface by a plane.
- Every contour need not form a curve. Some of the resultant contours can be a straight line as well.
- Here is the formal definition of a contour plot:
- A level curve of a function f(x,y) is the curve of points (x,y) where f(x,y) is some constant value, on every point of the curve. Different level curves produced for the f(x,y) for different values of c - can be put together as a plot, which is called a level curve plot or a contour plot.
- Every contour line in a contour plot is drawn for different value of z, each value a constant.
Applications of Contour Plots:
- A contour plot in cartography represents levels of equal elevation with respect to a base level.
- A contour line that connects places with the same temperature is called an isotherm. Remember, a level curve of f(x,y) has the same value z in all the points of x,y that curve passes through
- If a level curve is to be drawn for ocean depth where the ocean depth is the same on the places it connects it is called an isobath.
Drawing a Contour Plot using Python and Matplotlib:
- Create a list of x points
- Create a list of y points
- From x and y form a matrix of z values.
- Call the contour() function of matplotlib.pyplot module and display the plot.
Example 1:
|
import numpy as np # List of points in x axis # List of points in y axis # X and Y points are from -6 to +6 varying in steps of 2 # Z values as a matrix # Populate Z Values (a 7x7 matrix) - For a circle x^2+y^2=z # Print x,y and z values # Set the x axis and y axis limits # Provide a title for the contour plot # Set x axis label for the contour plot # Set y axis label for the contour plot # Create contour lines or level curves using matplotlib.pyplot module # Display z values on contour lines # Display the contour plot |
Output 1:

Example 2:
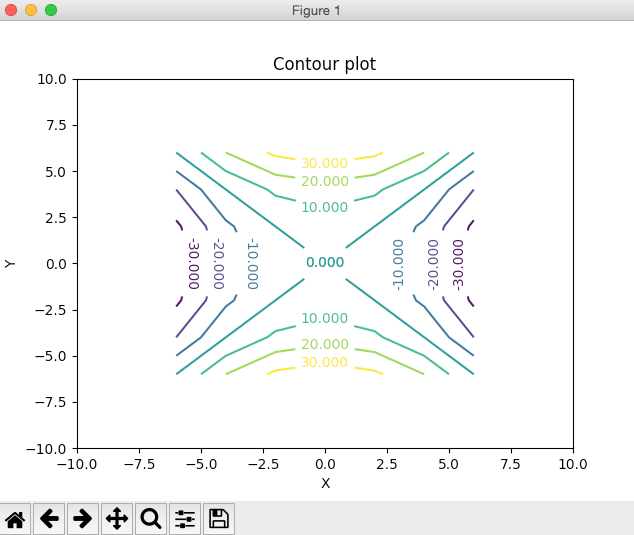
Here is the python program that plots the contour plots or level curves for a saddle surface which is a hyperbolic paraboloid.
|
import numpy as np import matplotlib.pyplot as plot # List of points in x axis # List of points in y axis # X and Y points are from -4 to +4 varying in steps of 2 # Z values as a matrix # Populate Z Values (a 5x5 matrix) - For a saddle surface/hyperbolic paraboloid, x^2-y^2=z # Print x,y and z values # Set the x axis and y axis limits # Provide a title for the contour plot # Set x axis label for the contour plot # Set y axis label for the contour plot # Create contour lines for the Hyperbolic Paraboloid using matplotlib.pyplot module # Display z values on contour lines # Display the contour plot |
